

Heads Up: Japan's Dual Market War At A Critical Point
Heads Up: Japan's Dual Market War At A Critical Point
JGB yields surge on BOJ buying less JGBs in regular operations. Not only has this not helped JPY strengthen, but JGBs and JPY are both sinking in tandem. Potential major and overlooked catalyst today.

◆JGB 10s looking to breach 1% (last YCC upper band level) - what will BOJ do (or not)?
◆Japan is trading like an emerging market: contrary to broad belief, USDJPY is moving with JGB yields, not UST yields
◆JGBs and JPY at critically low levels - why this time BOJ & MOF will have to choose one over the other
◆How to navigate BOJ website for real-time JGB operations announcements/results
There are two major macro market themes underway that are being largely overlooked, but need to be flagged and on your radar going forward for the immediate to short term (and highly likely far longer).
On Monday, BOJ made a slight reduction in the amount of 5-10Y JGB regular buying operations. This had caught JGB markets off-guard, and JGB yields across the entire curve have since surged. Outside of the JGB / rates trading world, this went largely unnoticed, ignored, or just surface-level-mentioned by financial media/commentary out there.
Among those who did take notice, this “surprise” less-buying of JGBs by BOJ was taken as a move to try and stem JPY downside, after USDJPY had already recovered its yentervention week -5% losses halfway back. Those who disagree with those who say this was BOJ’s motive are still missing the far more significant fundamental situation.
The debate over BOJ slightly reducing its scheduled JGB purchases on Monday being FX motivated or not (to the extent that such a debate is even going on in broader macro chatter) - this is not the relevant discussion, because both sides are under the base assumption that higher JGB yields are JPY positive. That is not the case in current market behavior - rather, it is the opposite. And so that not only is significant in and of itself, but that fundamental misread itself is significant.
The 2 key points that need to be understood and explored, for which this article will cover, are as follows:
▷ 10Y JGB yields have broken out to new decade highs this week and are now the closest to hitting the very key 1% level than they have been since BOJ embarked upon this radical easing / BOJ amassing / yield capping experiment. If/when 10Y JGB yields print 1% - what will BOJ do (or not)? What will FX and bond markets do? And with BOJ and markets staring one another down - which one moves and which one reacts?
▷ USDJPY is moving in tandem with JGB yields, NOT US yields - meaning, higher JGB yields is coinciding with weaker JPY, and not the other way around as per conventional understanding. Are cross-asset markets aware of this non-consensus reality currently underway? And perhaps more critically - is a currency-minded “hawkish” BOJ aware of this? Because if they are NOT, and they wish to strengthen JPY, they may very well unknowingly enact the exact opposite prescription vs what is needed, and get JGB yields higher - and if current market dynamics remain as is, this would be a disastrous shooting one’s self in both feet as both JGB yields and USDJPY push higher. If they ARE aware of this current JPY/JGB directional relationship and decide to play along - does this mean BOJ may already contradict their normalization path that is still in its infancy?
Let’s explore the above.
US - JP Yield spreads are narrowing
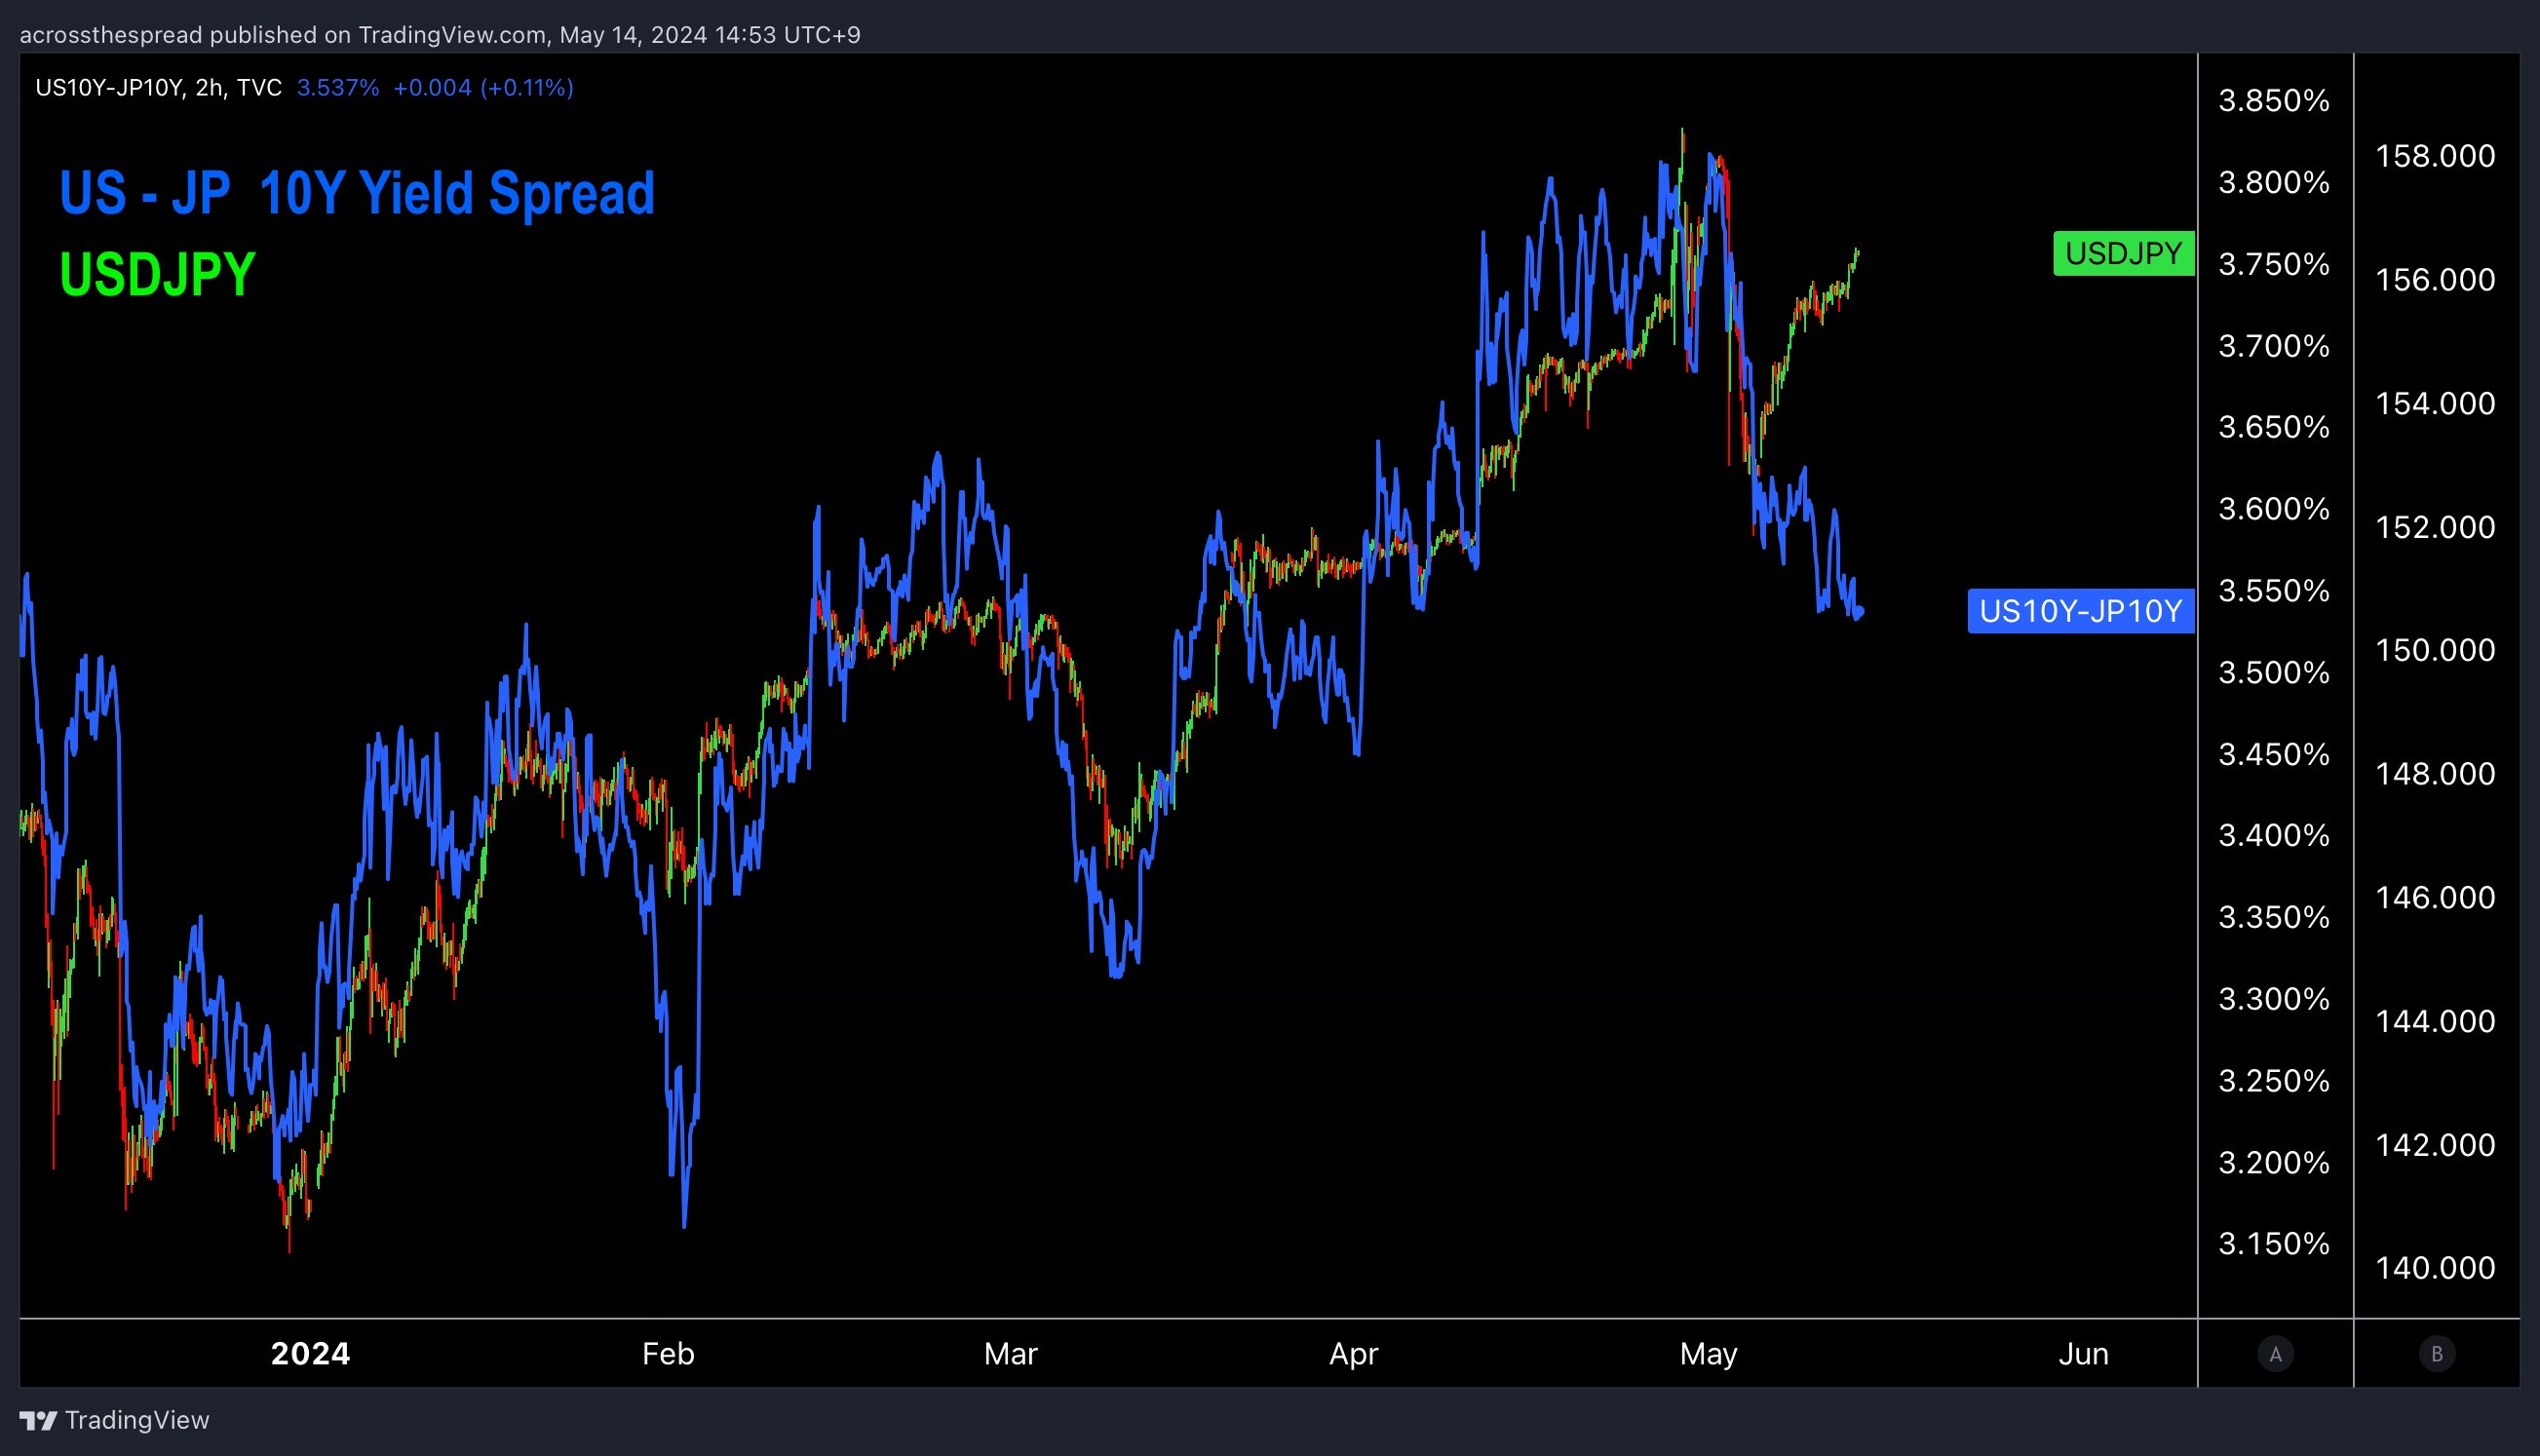
First it’s important to note that post-yentervention week at the start of May, USDJPY and US-JP yield spreads have completely diverged:
This is significant.
See the below from Bloomberg with a contradictory title that is self-evident in the very chart attached to it (regardless of using the US-JP real yield spread or nominal yield spread) - the title should be “Japan is struggling with with yen weakness despite a narrowing yield gap”
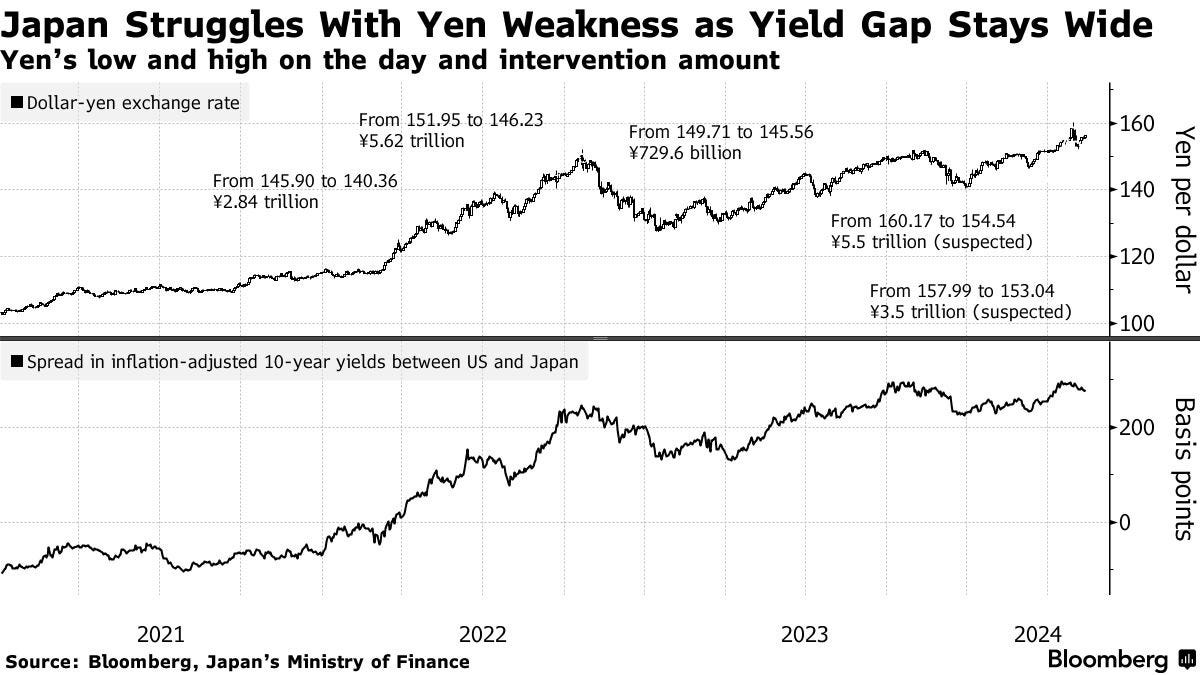
One of the reasons the above chart is useless is because of how zoomed out it is- capturing a multi-year time frame for a week (or intraday) point to make. If you look closely at the above, you’ll actually even see that the USDJPY top panel chart moves upward, while the US-JP yield spread bottom panel chart turns downward.
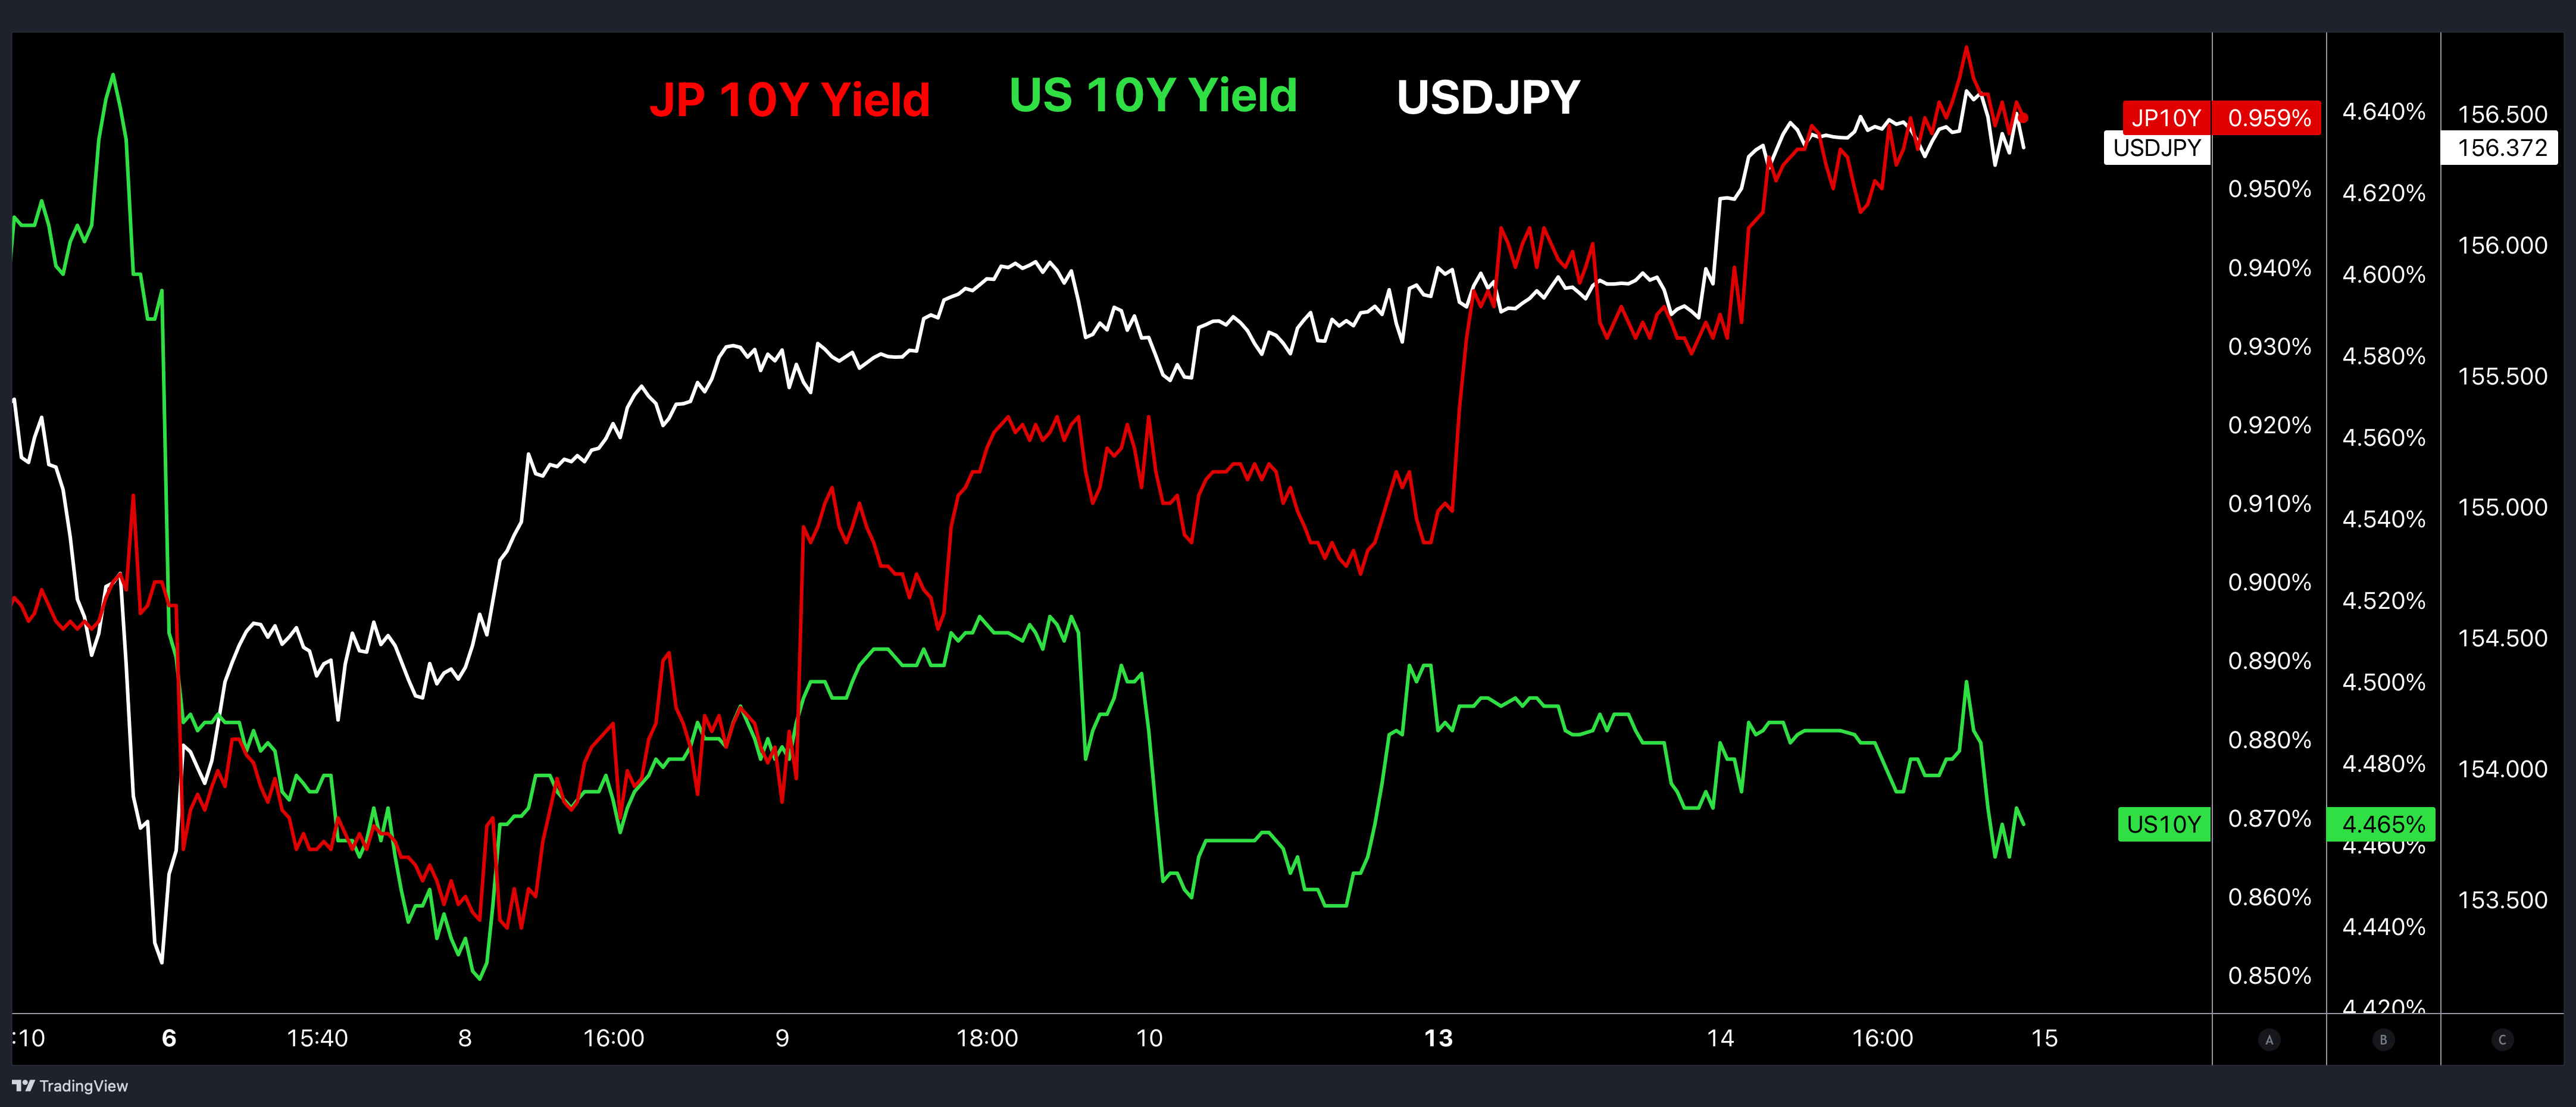
Here is the 10Y US-JP yield spread vs USDJPY chart on a visually appropriate time scale showing the clear directional divergence - USDJPY rises despite yield spreads contracting:
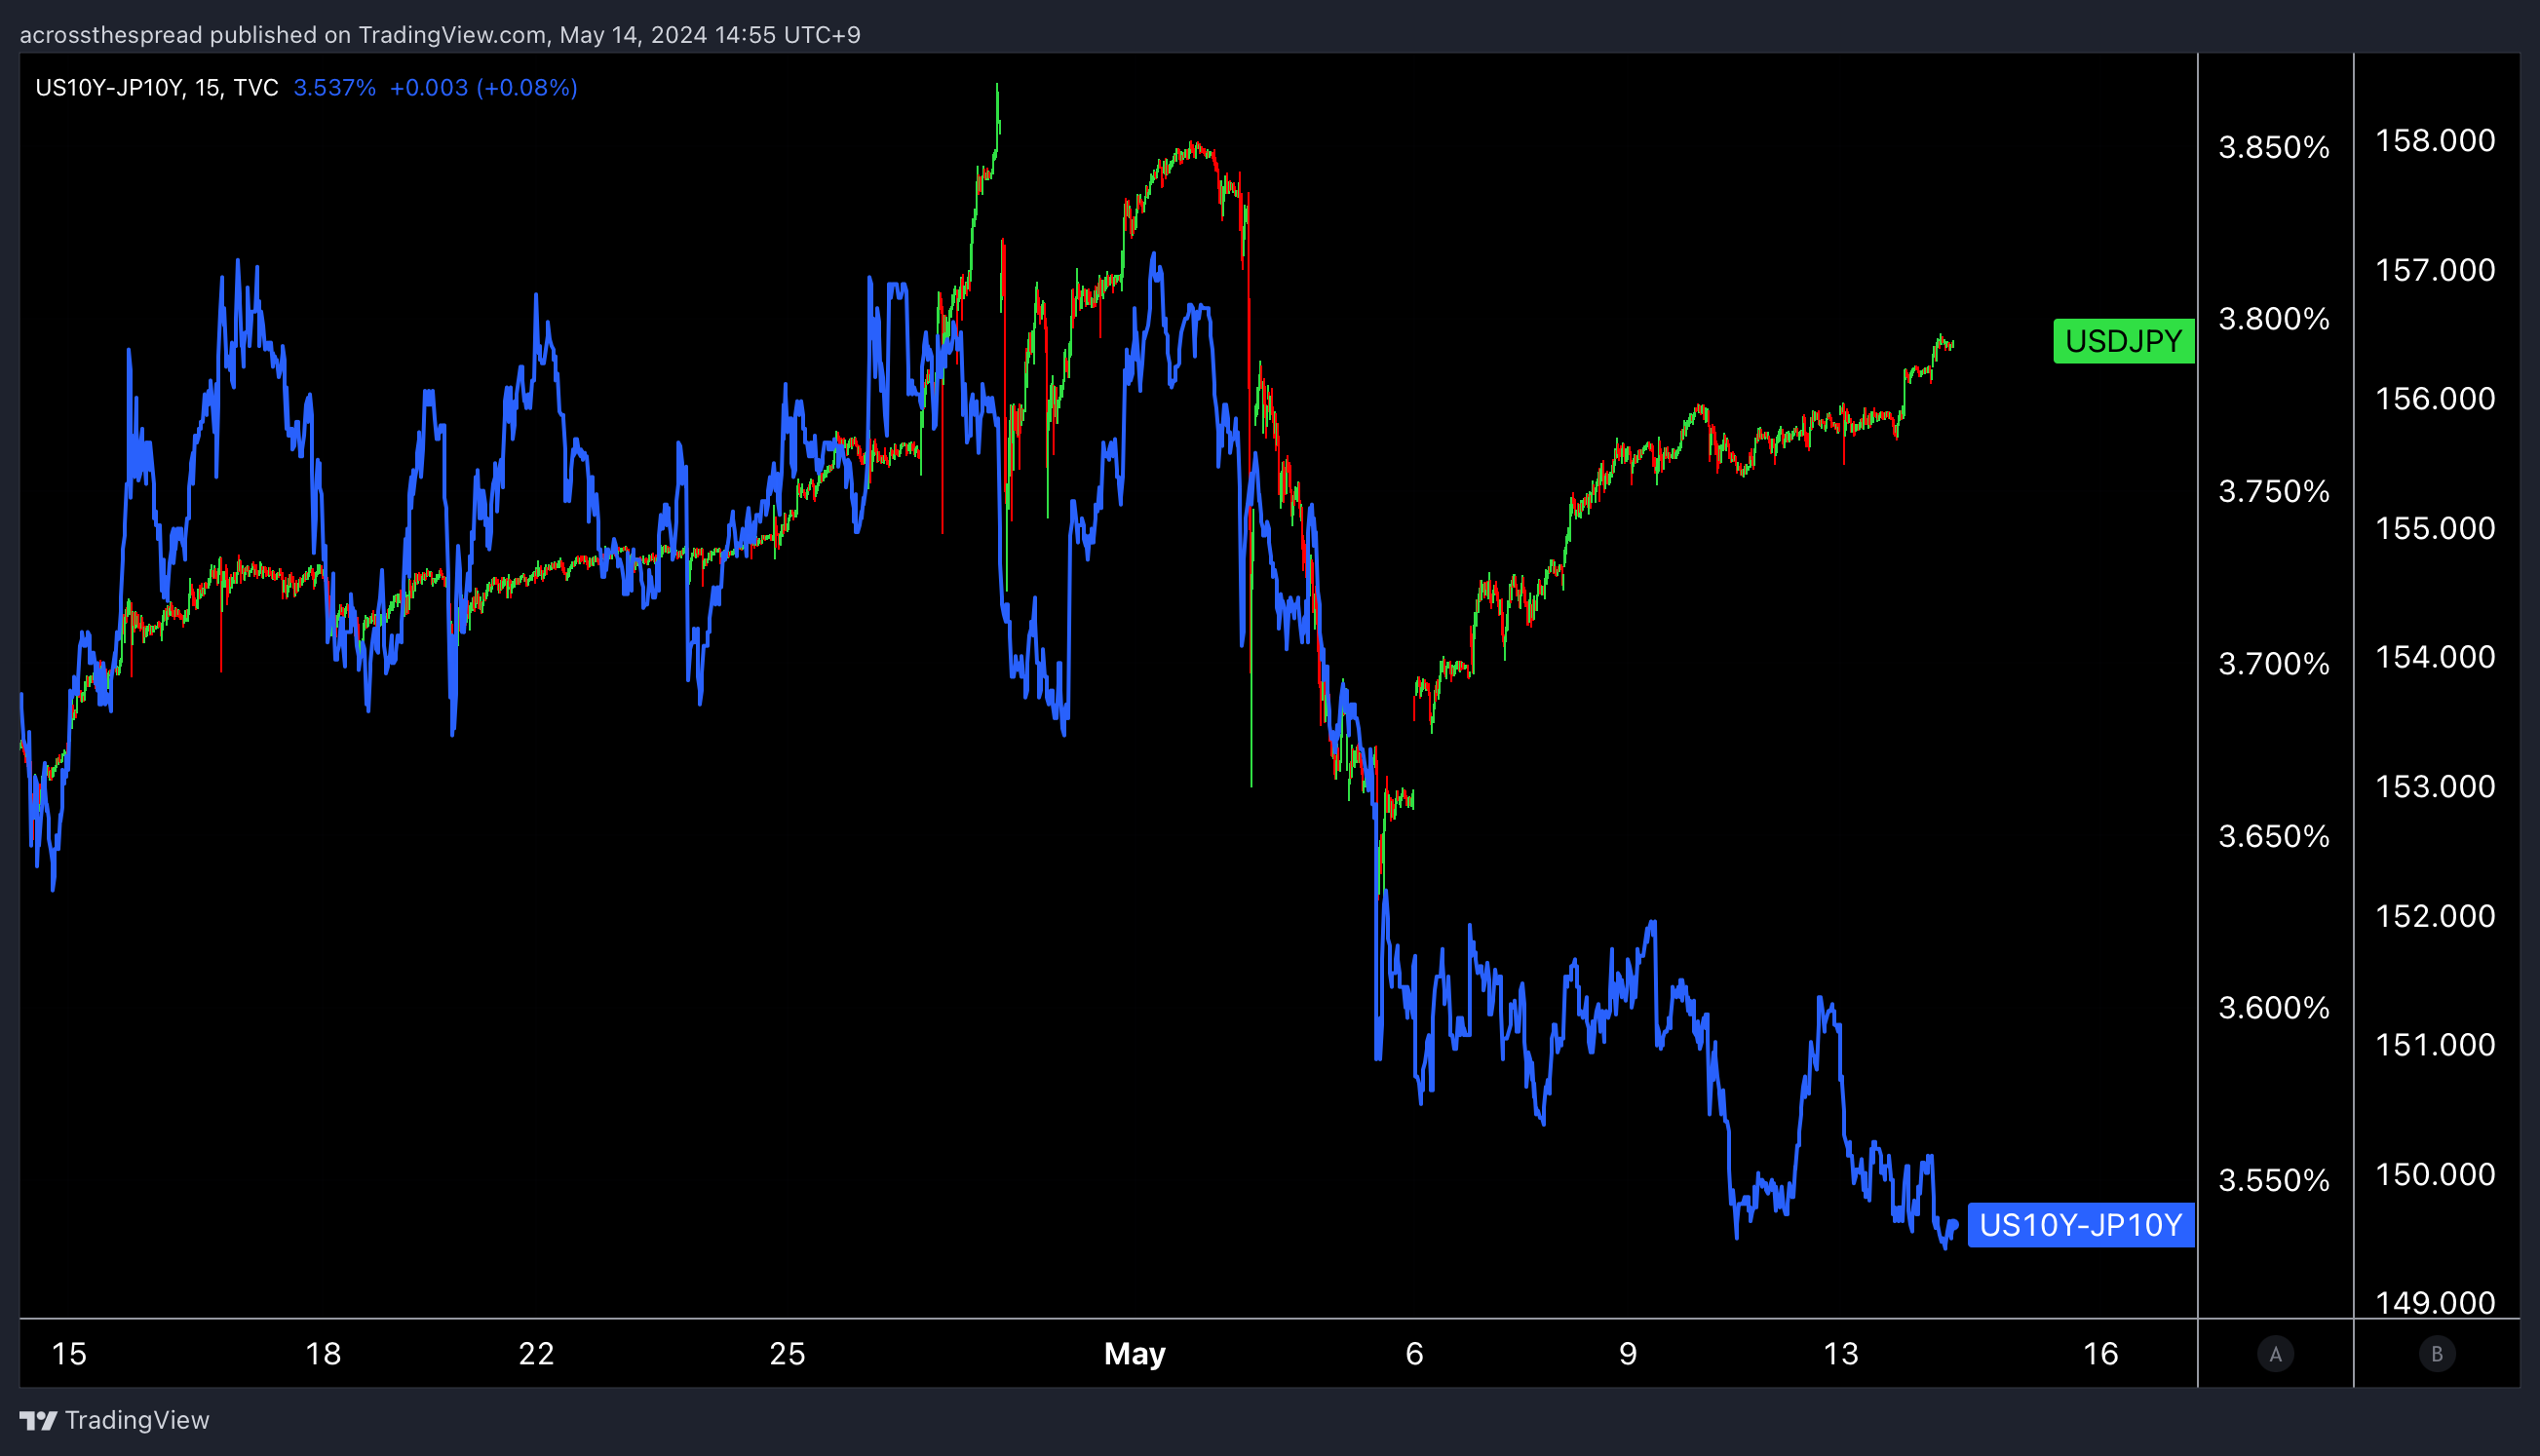
Why is this divergence happening?
Here is another useless chart from Bloomberg of why it’s NOT happening - USDJPY is NOT falling (or rising) with US yields - and definitely not “just like 2022” October yentervention:
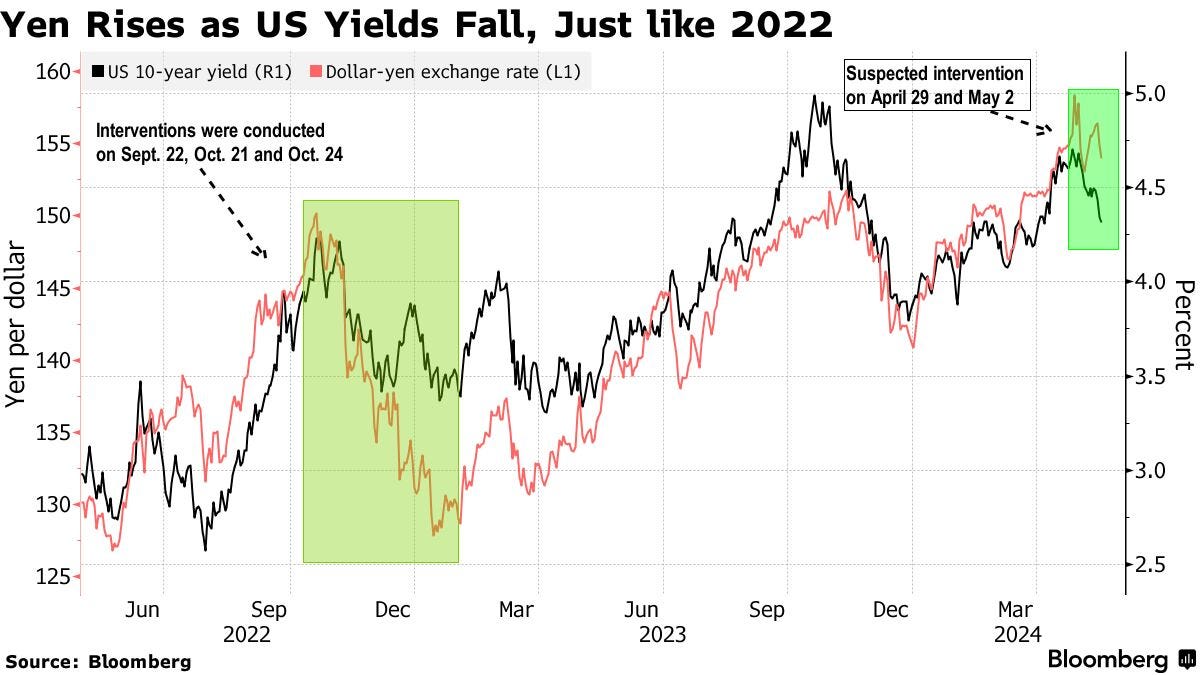
Let’s break down the US-JP yield spread part. The gap between 10Y US Treasury yields and 10Y JGB yields are compressing because of contribution from both sides: US yields are moving down, AND JGB yields are moving up.
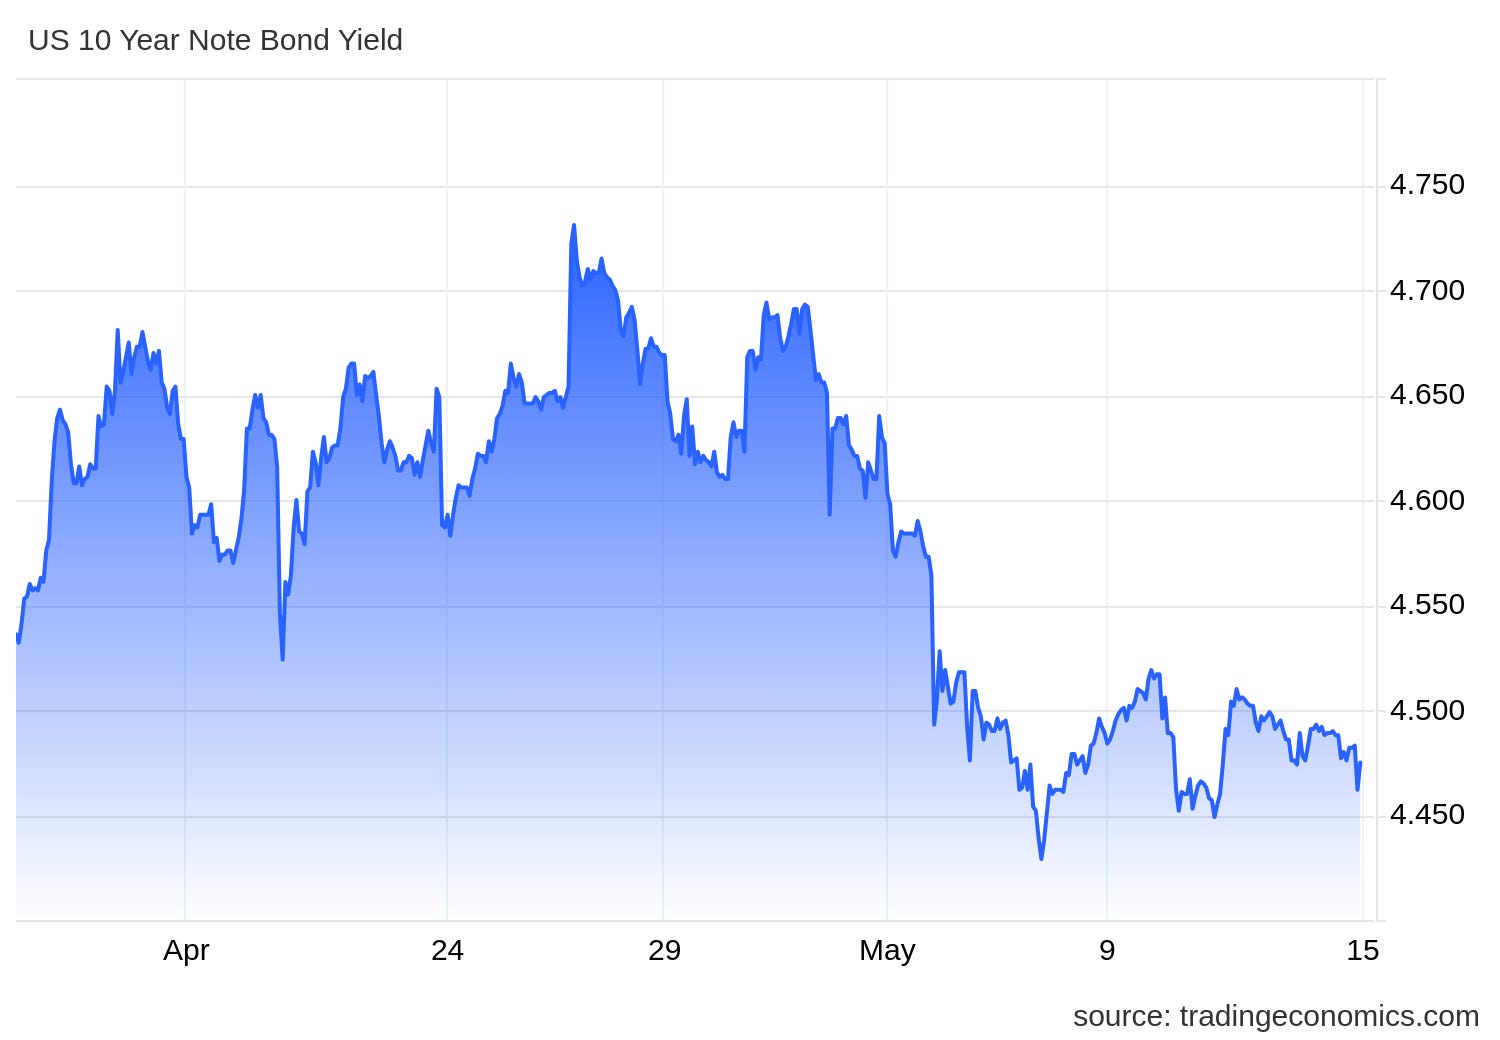
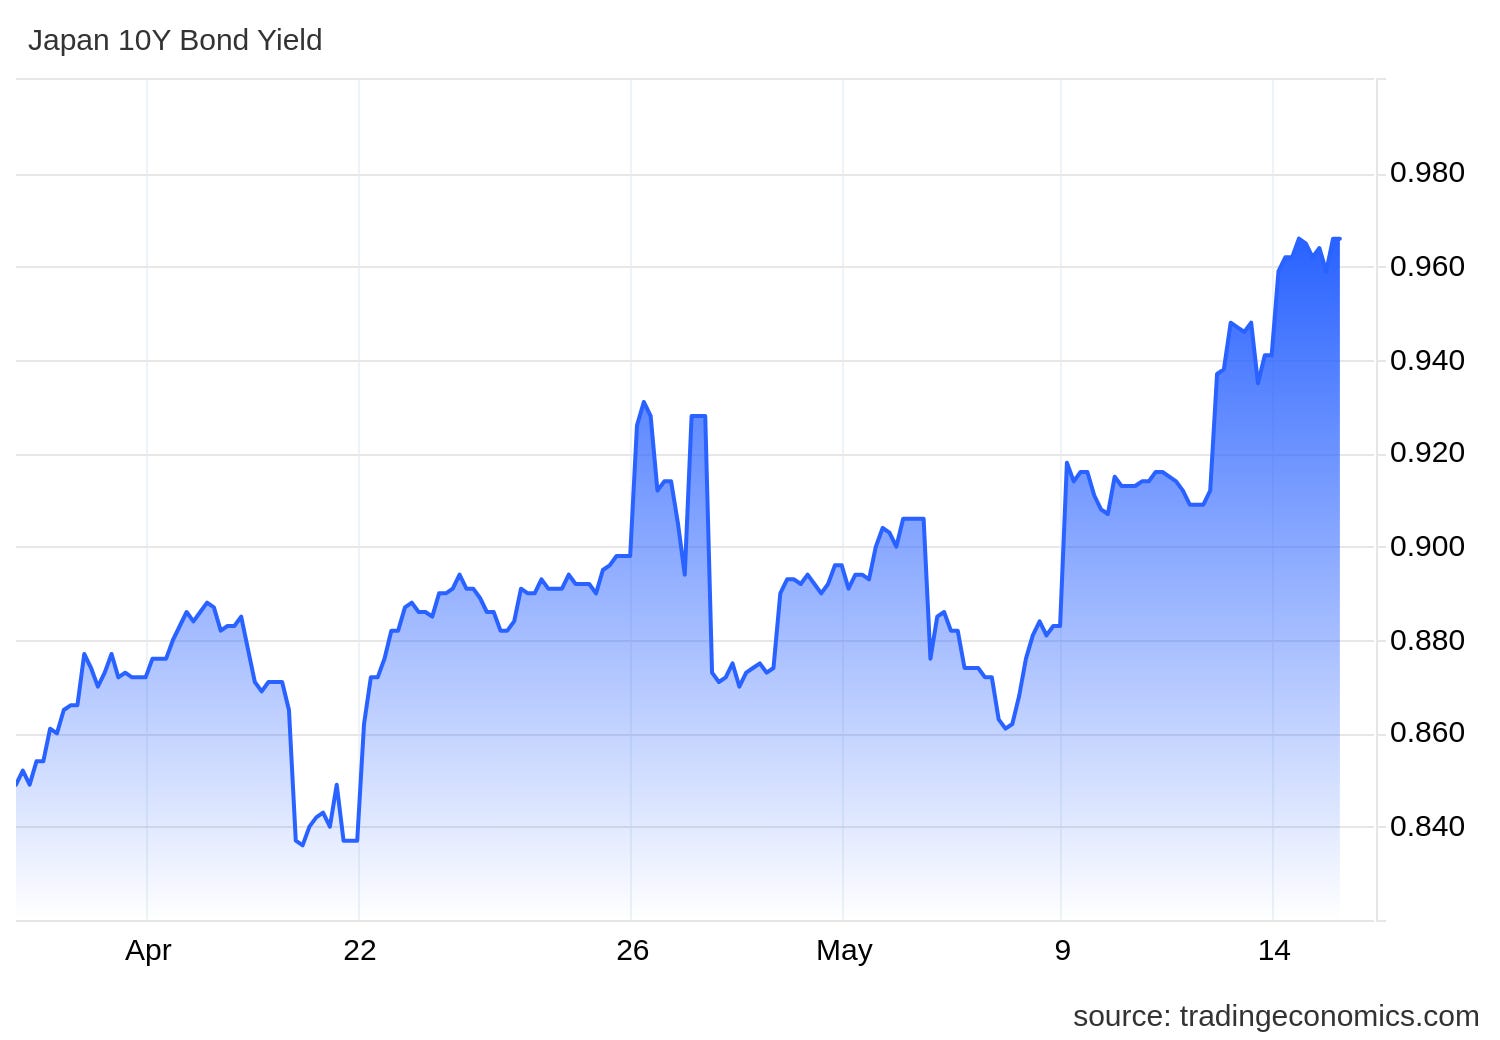
In the week following yentervention week earlier this month (up until US softer CPI release this week):
•USDJPY rose from 153 → 156.50
•US 10Y yield dropped from 4.6% → under 4.5%
•JP 10Y yield rose from 0.87% → 0.965%, breaking through new multi-decade highs
And it’s the latter that is a red flashing warning light - the JGB side, both standalone, as well as its directional correlation with JPY.
Keep reading with a 7-day free trial
Subscribe to Across The Spread to keep reading this post and get 7 days of free access to the full post archives.