Asia Market Price Action Post-FOMC Rate Cut Explained
Fed kicks off a "jumbo" 50bp rate cut - so why are JPY, USTs and US equities selling off? Why is NKY rallying? The cross asset Asia session of green & red blinking tickers explained.
Fed CUTS -50bps for the September 2024 FOMC. Mighty.
So then what the hell is JPY, USTs and US equities selling off for?
Because -50 wasn't a massive shock - it was half way priced in. And once you get the binary decision of where Fed Funds are, that’s where STIRS will adjust to, and dead-stop.
And JPY, which, as a "Fed trade” (or, half of the Fed vs BOJ trade), moves alongside short term rate instruments. So when Sept'24 Fed Funds futures are effectively “settled” at 2pm EST on Sept'24 FOMC day, they flatline in price- but JPY obviously continues ticking. And so that part of the trade is now “over” - and JPY strength that followed FOMC ceased to be supported.
Simple as that.
Asia Trading Session: the first full (real) market reaction to FOMC
JPY gets hit starting from and throughout the Japan AM trading session, particularly against USD (of course), with USDJPY’s >1% upside momentum taking a breather into AM close, just shy of 144.
But there is far more going on cross asset in the Asia session, the (always) first market to really react to any FOMC / press conference in full.
Here's the green and red blinking ticker cross asset rundown.
USDJPY spot:
NKY Futures and USDJPY continued to be tied at the hip - through FOMC, into US close (higher, whereas US indices closed off their highs), and NKY and TOPIX indices ripped over +2% right from the Japan AM open - all in line with USDJPY (and/or vice versa).
On a shorter term (intraday) horizon, NDX and NKY futures actually have been trading directionally inverse with one another. You can see it at the knee-jerk move upon FOMC release (NDX up, NKY down), as well as the reversals into US close (NKY up, NDX down), and you can see it from Asia market open today, with NKY soaring higher while NDX dipped downwards.
Note that this NDX vs NKY shorter term diverging price action behavior has been going on post-JPY blowing the world + sharp un-blowing up moment:
…because the market dynamics are now such that NKY moves down with a strengthening JPY, whereas NDX strengthens - highly likely as a result of would-be Japan equity inflows going to NDX after a double digit percentage Black Monday down day, followed by a double digit percentage Green Tuesday - Japan says no thanks, NKY. In other words, NDX's recent rallying is at the expense of Japan doing the opposite.
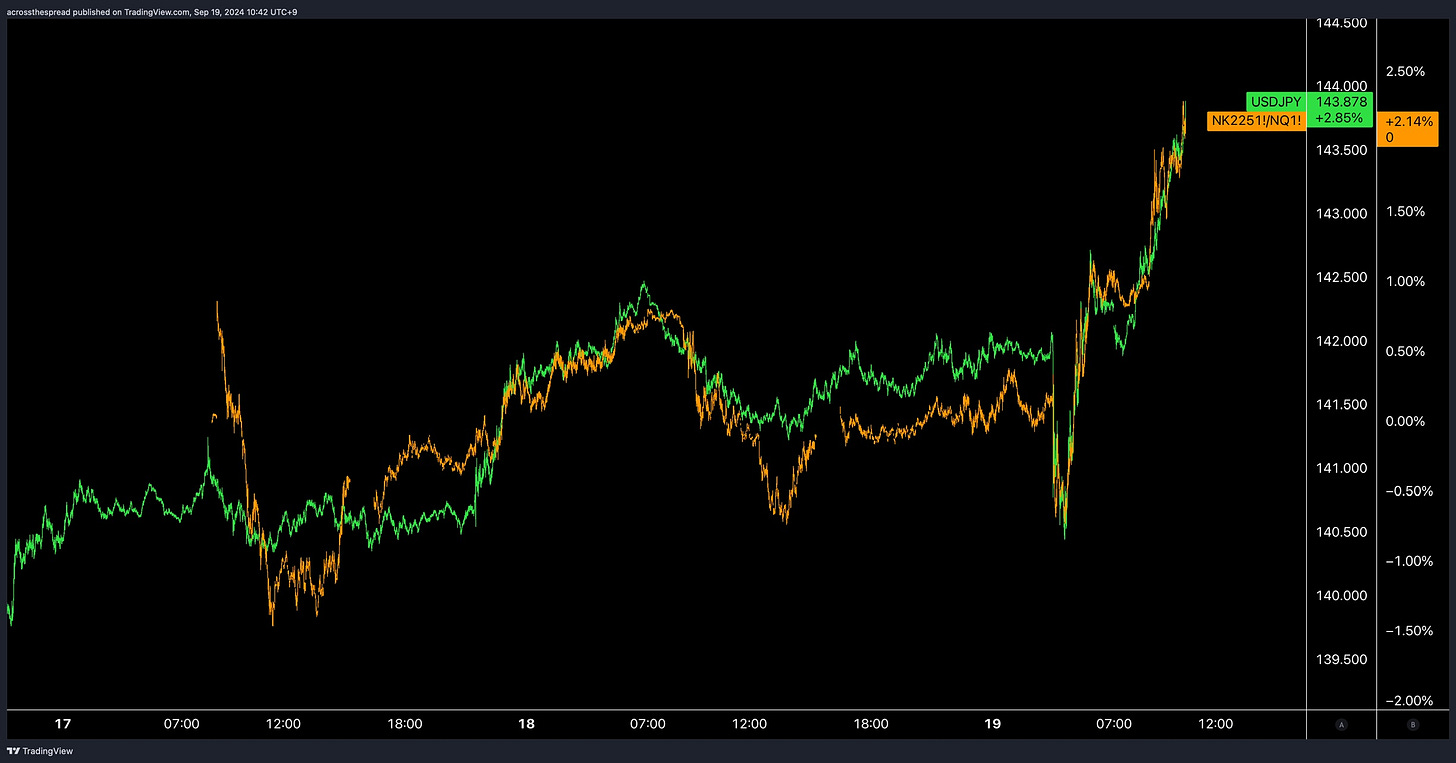
NDX is not moving on its own volition- still. Here's the NKY / NDX ratio (long NKY / short NDX) vs USDJPY:
And since NKY moves near-lockstep correlated, if not directionally parallel with USDJPY on a short term window, that would mean NDX also moves inverse to USDJPY as well.
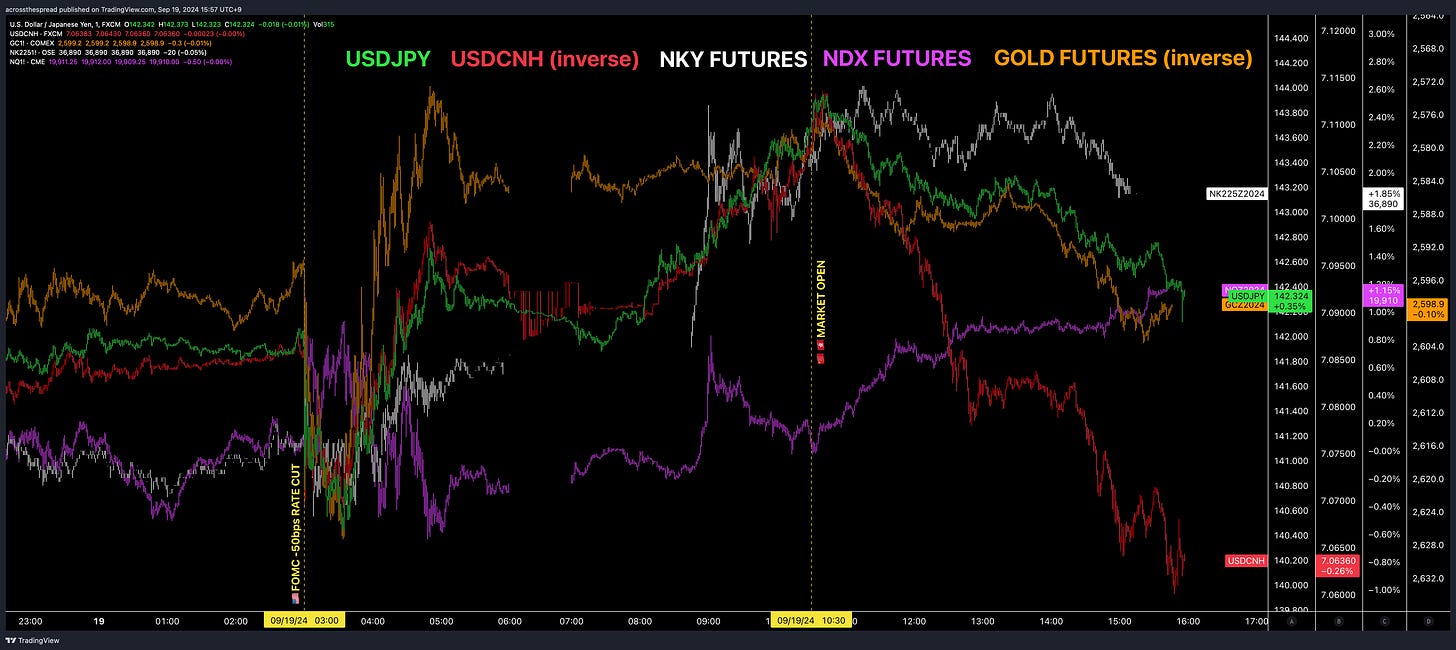
Now, you may have noticed in the two charts above that I've timestamp marked China/HK open at 🇯🇵10:30AM - as this was a turning point for NKY (top), NDX ("bottom” - not bottom tick, but Japan session lows).
China yuan's strength ran (and as of this writing, is still running) the show.
I have been watching this all day - USDCNH has been dropping aggressively downwards, as China and PBOC finally got the Fed rate cut cycle that they desperately needed for the past… several years really. And an aggressive kickoff from the US rate cutting cycle at that. USDCNH is now approaching 7, looking to potentially break into the 6-handle.
And that is driving everything.
USDCNH's relentless move down is pouring cold water on USDJPY's rally, and pulling it down (pulling USD down, pushing JPY up). Note that CNH's rally during JPY's selloff in the Asia AM session took CNHJPY back above 20 again - China's one-way upside is out-strengthening JPY.
So - USDCNH aggressively down is pulling USDJPY down. That in turn is pulling NKY's surge down. That in turn is pushing the inverse-moving NDX up.
Furthermore, regarding gold futures - gold has also been re-correlated to JPY (or inverse to USDJPY), as I've shown in my previous article, and that remains the case before, through, and after FOMC. So, you get a mirror-inverse drop in gold as you get a jump in USDJPY - and likewise, you get a bottom in GC futures (again, at China AM market open today) and reversal, upon the USDJPY top and reversal.

Here is a different version/view/setup of this JPY vs Gold vs Yuan price action dynamic from mid-day upon Japan PM session open (I told you I have been watching this like a hawk all day)
So. Put it all together and what do we have?
My observation of green and red blinking tickers, cross asset, post FOMC, and what is driving what is as follows…
AS LONG AS USDCNH CONTINUES TO DROP, then in the immediate:
USDJPY ↓
NKY Futures / Japan equity indices ↓
NDX, SPX, and EU / DM indices ↑
Gold ↑
But if USDCNH takes a break from this huge move after I write and publish this, as I would imagine that 7.0 has to be a hard stop floor (temporary or otherwise), reverse the arrows on the above accordingly.
There is your post FOMC -50 cut rundown of green and red blinking tickers, which I've purposely separated from my coming commentary on the Bank of Japan - for which I argue that FOMC -50bps “insurance cut” AND the subsequent market reaction we're seeing (provided USDCNH doesn't pull the Japan markets into a sharp risk-off in the next < 20 hours) -
Consensus “No Hike” policy from Bank of Japan this Friday is seriously mispriced in light of FOMC. The markets, market participants, “economists and strategists” and the like, are severely underpricing the Bank of Japan's probability to hike rates tomorrow.
I am not saying that BOJ will definitely hike rates tomorrow. I am saying its far more a 50/50 (or maybe even 60/40) chance of a hike, vs the literal 0% probability and expectations that the world at large is assuming as we speak.
Stay tuned for the next one - but the reason I am teasing (mentioning on record now) is because - also stay tuned for a potential Nikkei press pre-announcement that may drop before I get that next view out.
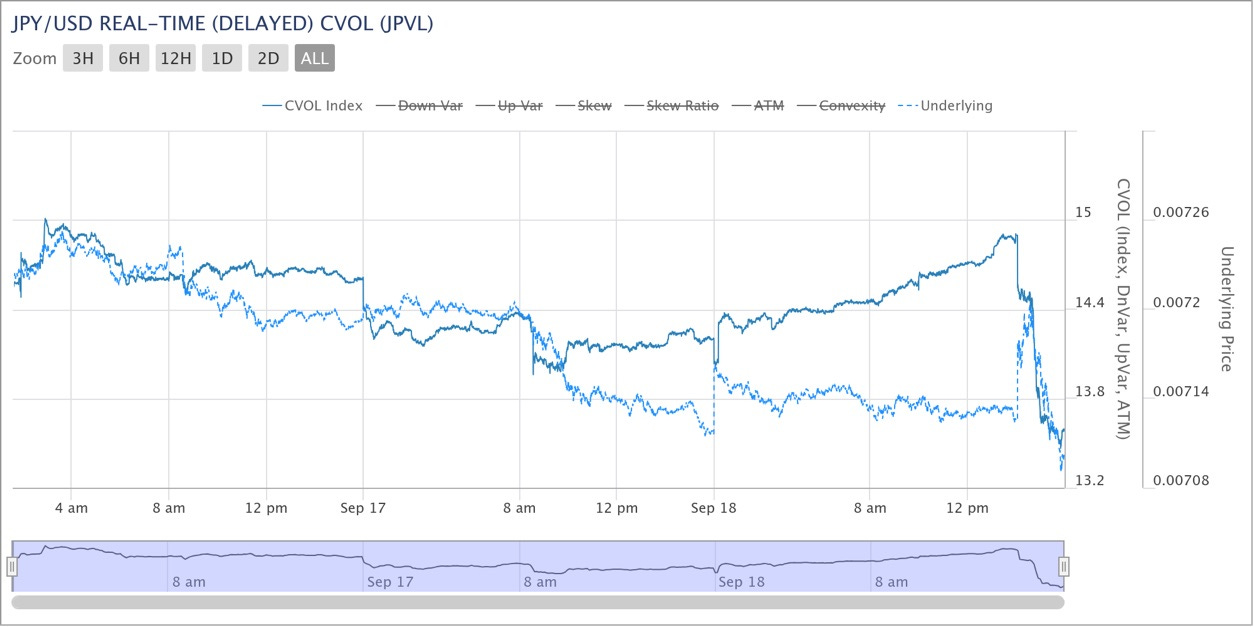
I will also explain my long JPY trade within the next piece as well, as my long JPY trade - for which I also have a long JPY put that I added onto the trade as JPY rallied into the end of the week, rather than taking some profit when JPY strengthened sub USDJPY 140 - and although those puts are in the green today, they're not really hedging my -1.2% JPY futures longs, as implied vol of course collapsed post FOMC - sloppy trading…
But - my not closing out JPY long pre-BOJ is predicated on this mispricing of a “0% chance BOJ moves tomorrow” consensus.
It's not over yet- its just begun.
And by the way, yeah the Bank of England in a few hours REALLY matters as well, and Bailey-san can seriously shake things up too.
Thanks as always,
Weston


Not sure if you cover it but $ASEA (singapore, malaysia, indonesia, etc) has been up only and even unphased through the crash. I know it has favorable backdrops like demographics, china decoupling, falling dollar, etc but those themes have been around for a while. Anything behind this particular outperformance from all the other international indices?