


“Mag Seven?” “Mag One?” Its: “Mag (Nikkei) 225” That Is Driving DM Equities
NVDA is driving SPX, and NKY is driving NVDA. With US equity performance dependent on ONE stock - better find out what that one stock moves to: Nikkei225.

Really- so is no longer “Mag 7” - and now it’s just “Mag 1” ? One stock, NVDA, is responsible for how the S&P500 performs?
Well, what if I were to tell you that if it is now “Mag 1” - it’s actually more like “Mag 0.5” - because that “Magnificent NVDA” itself is not exactly moving autonomously in either direction.
Here are some charts to illustrate how the NKY continues to influence the “Mag 1”
NVDA shares had a wild Friday trading session, with -$245 billion in market value wiped out in a 3-hour window.
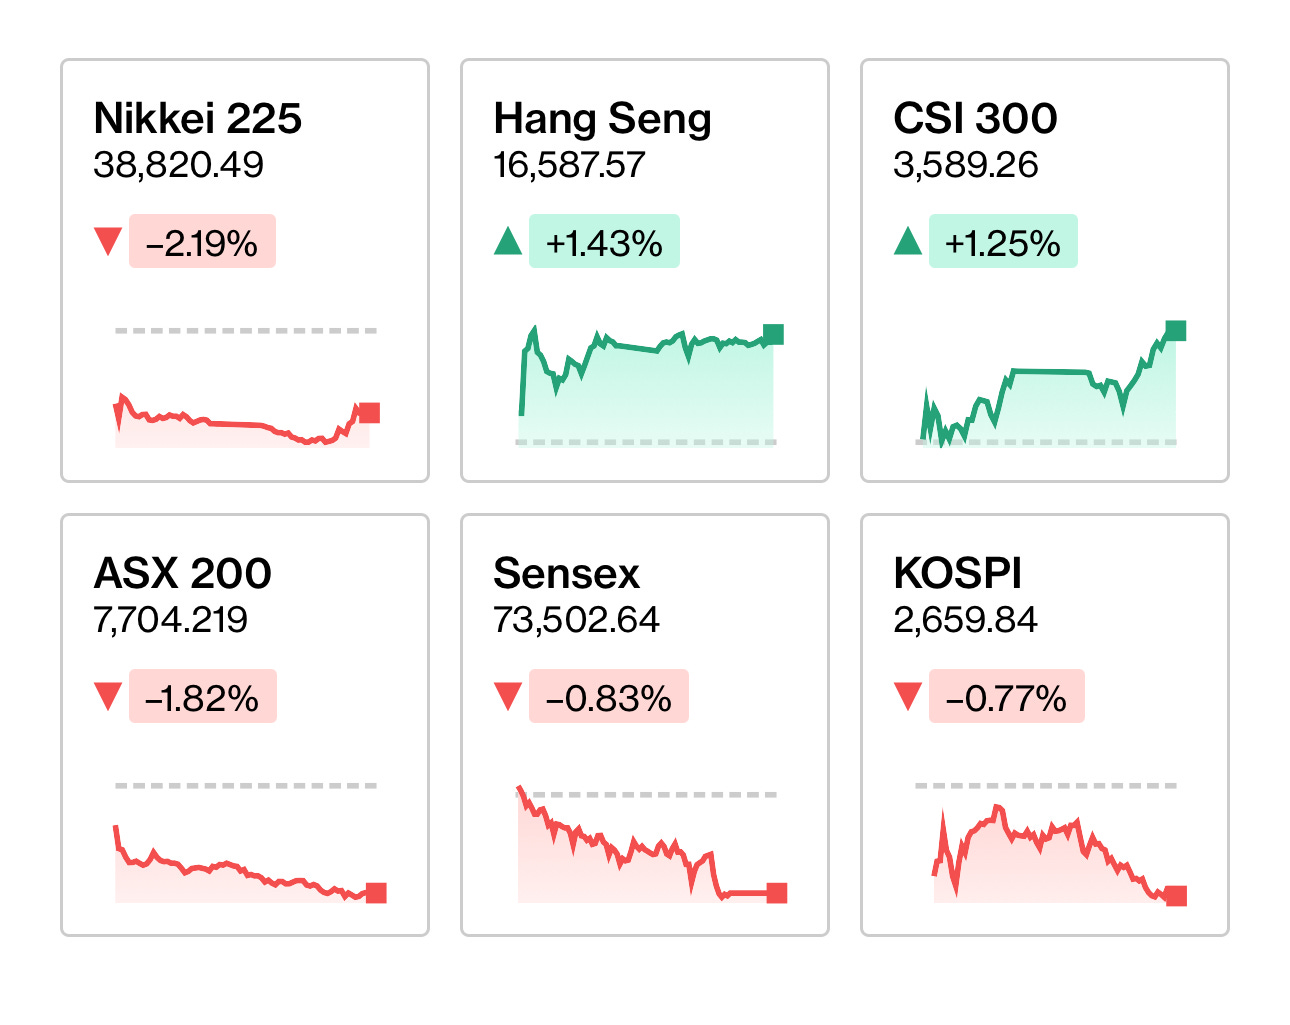
Then come Monday morning (today), NKY 225 cash index, as well as TOPIX index get slammed, at one point down almost -3% on the day and (for once) vastly underperforming global DM indices for the worst day in Japan equities since October.
And yes, it goes both ways between NVDA ⇆ NKY as to which is driving which. But since it not only leans more towards NKY as the driver of NVDA (as per a year ago with NKY driving NDX), and because financial media always defaults to “Japan stocks fall (or rise) on the heels of a weak (or strong) US market…” and rarely, if ever, the other way around - I will show updated charts of how NKY is dictating SPX / NDX (via NVDA), as readers and followers of Across The Spread would already be long familiar with in concept.
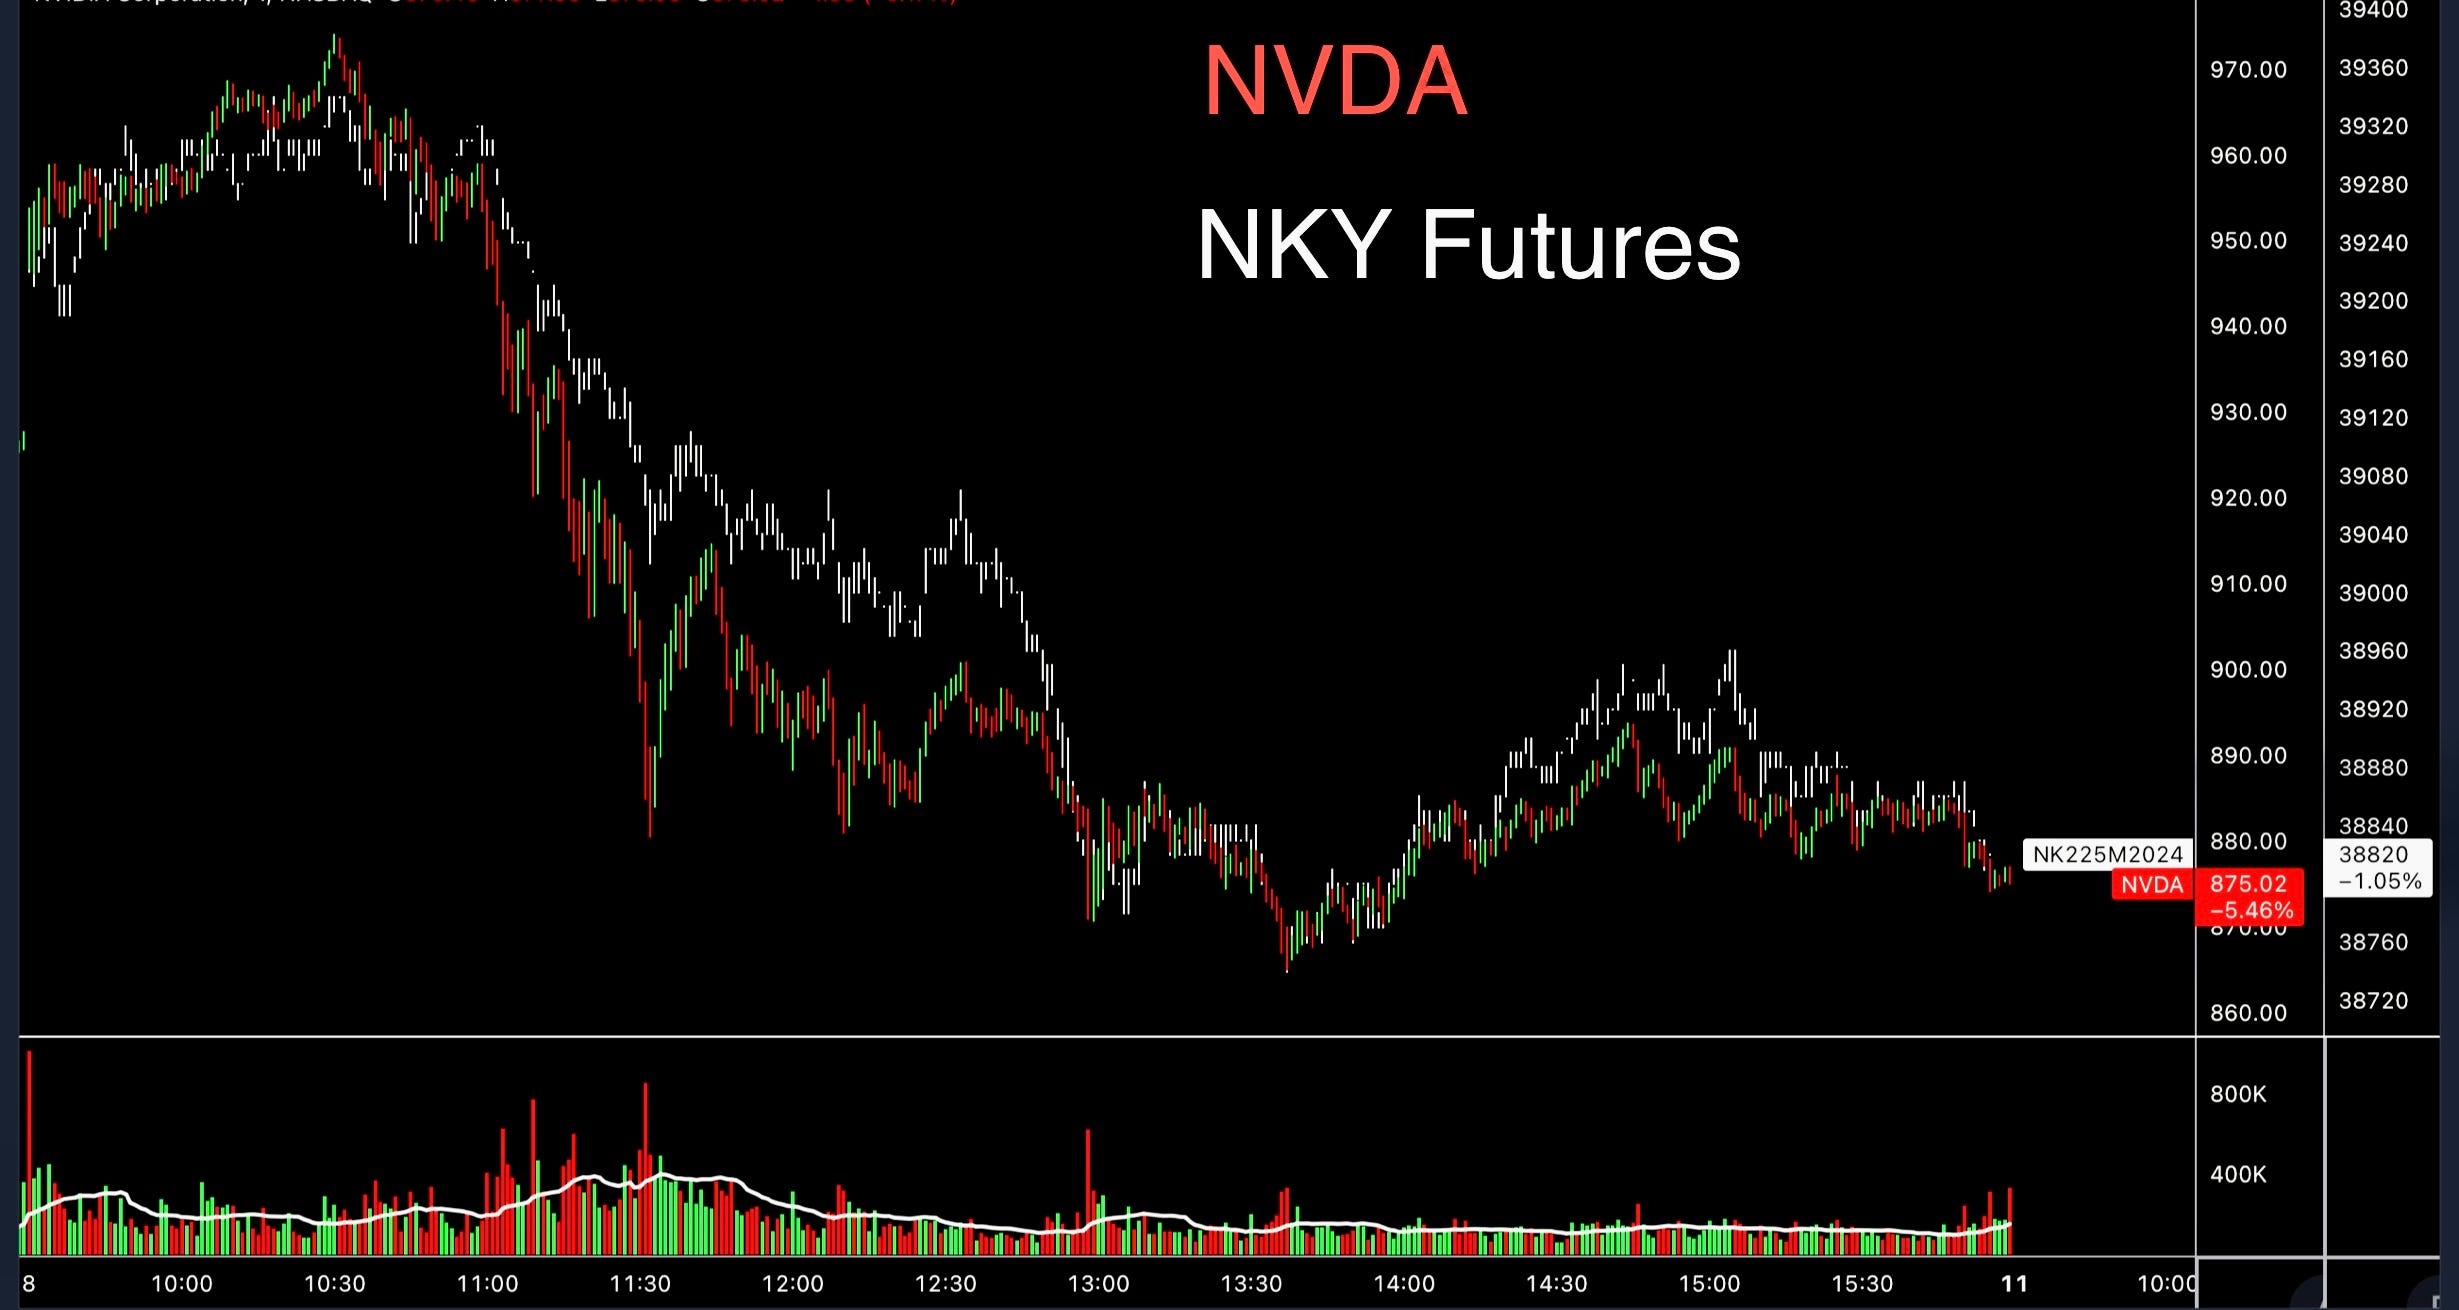
Here is once again NVDA and NKY futures from Thursday to Friday during US market hours (in other words- below is an NVDA chart with NKY futures that trade round the clock overlaid, thereby cutting out any NKY trading outside of U.S. hours). Here, you can see that Friday NVDA jump and crash pronounced more clearly.

Before going into WHY this chart looks the way it does- just the fact that NVDA green and red blinking tickers attempt to go rogue and do so temporarily, but then crash to re-align with NKY (rather than NKY jumping upwards to meet NVDA higher) shows which is moving at the helm of which.
So, one can look at NVDA -5% on Friday, followed by NKY -2% on Monday as “Japan follows US downwards” - but note that on Thursday - Friday, NKY futures stopped the runaway upside and sharply reversed to fall -2% intraday. Why?
Recall my note from last week on NKY March “SQ,” or “Special Quotation” (futures and options quarterly expiry and settlement) - and that crowded NKY 40,000 strike call options position outstanding. Those March NKY contracts did NOT expire above 40,000, despite having been north of 40k earlier in the week - as the index was sharply shoved down below the 40k handle with just a day left for last trade date.
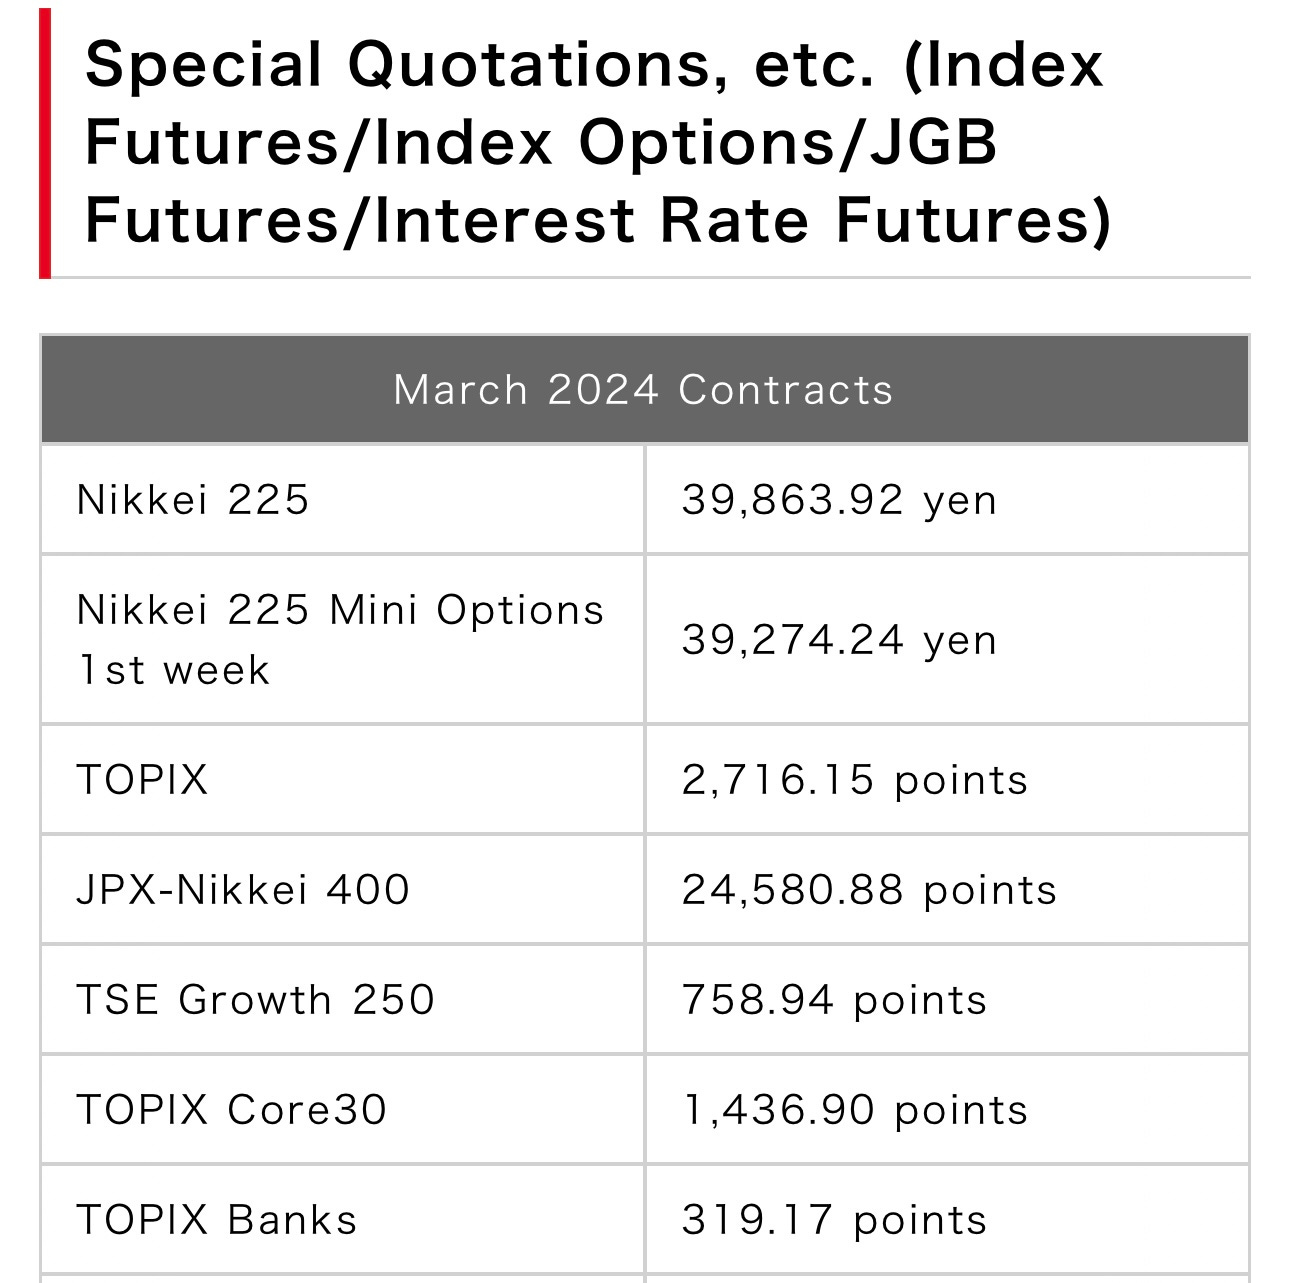

Not to mention just the simple NKY 40,000 being the DM equity world’s last resistance level left, as per verbatim of the title of my article - and NKY has yet to break clean through that 40,000 resistance - a real resistance level indeed.
So, here is that same chart from above again, with the elusive NKY 40,000 level marked:
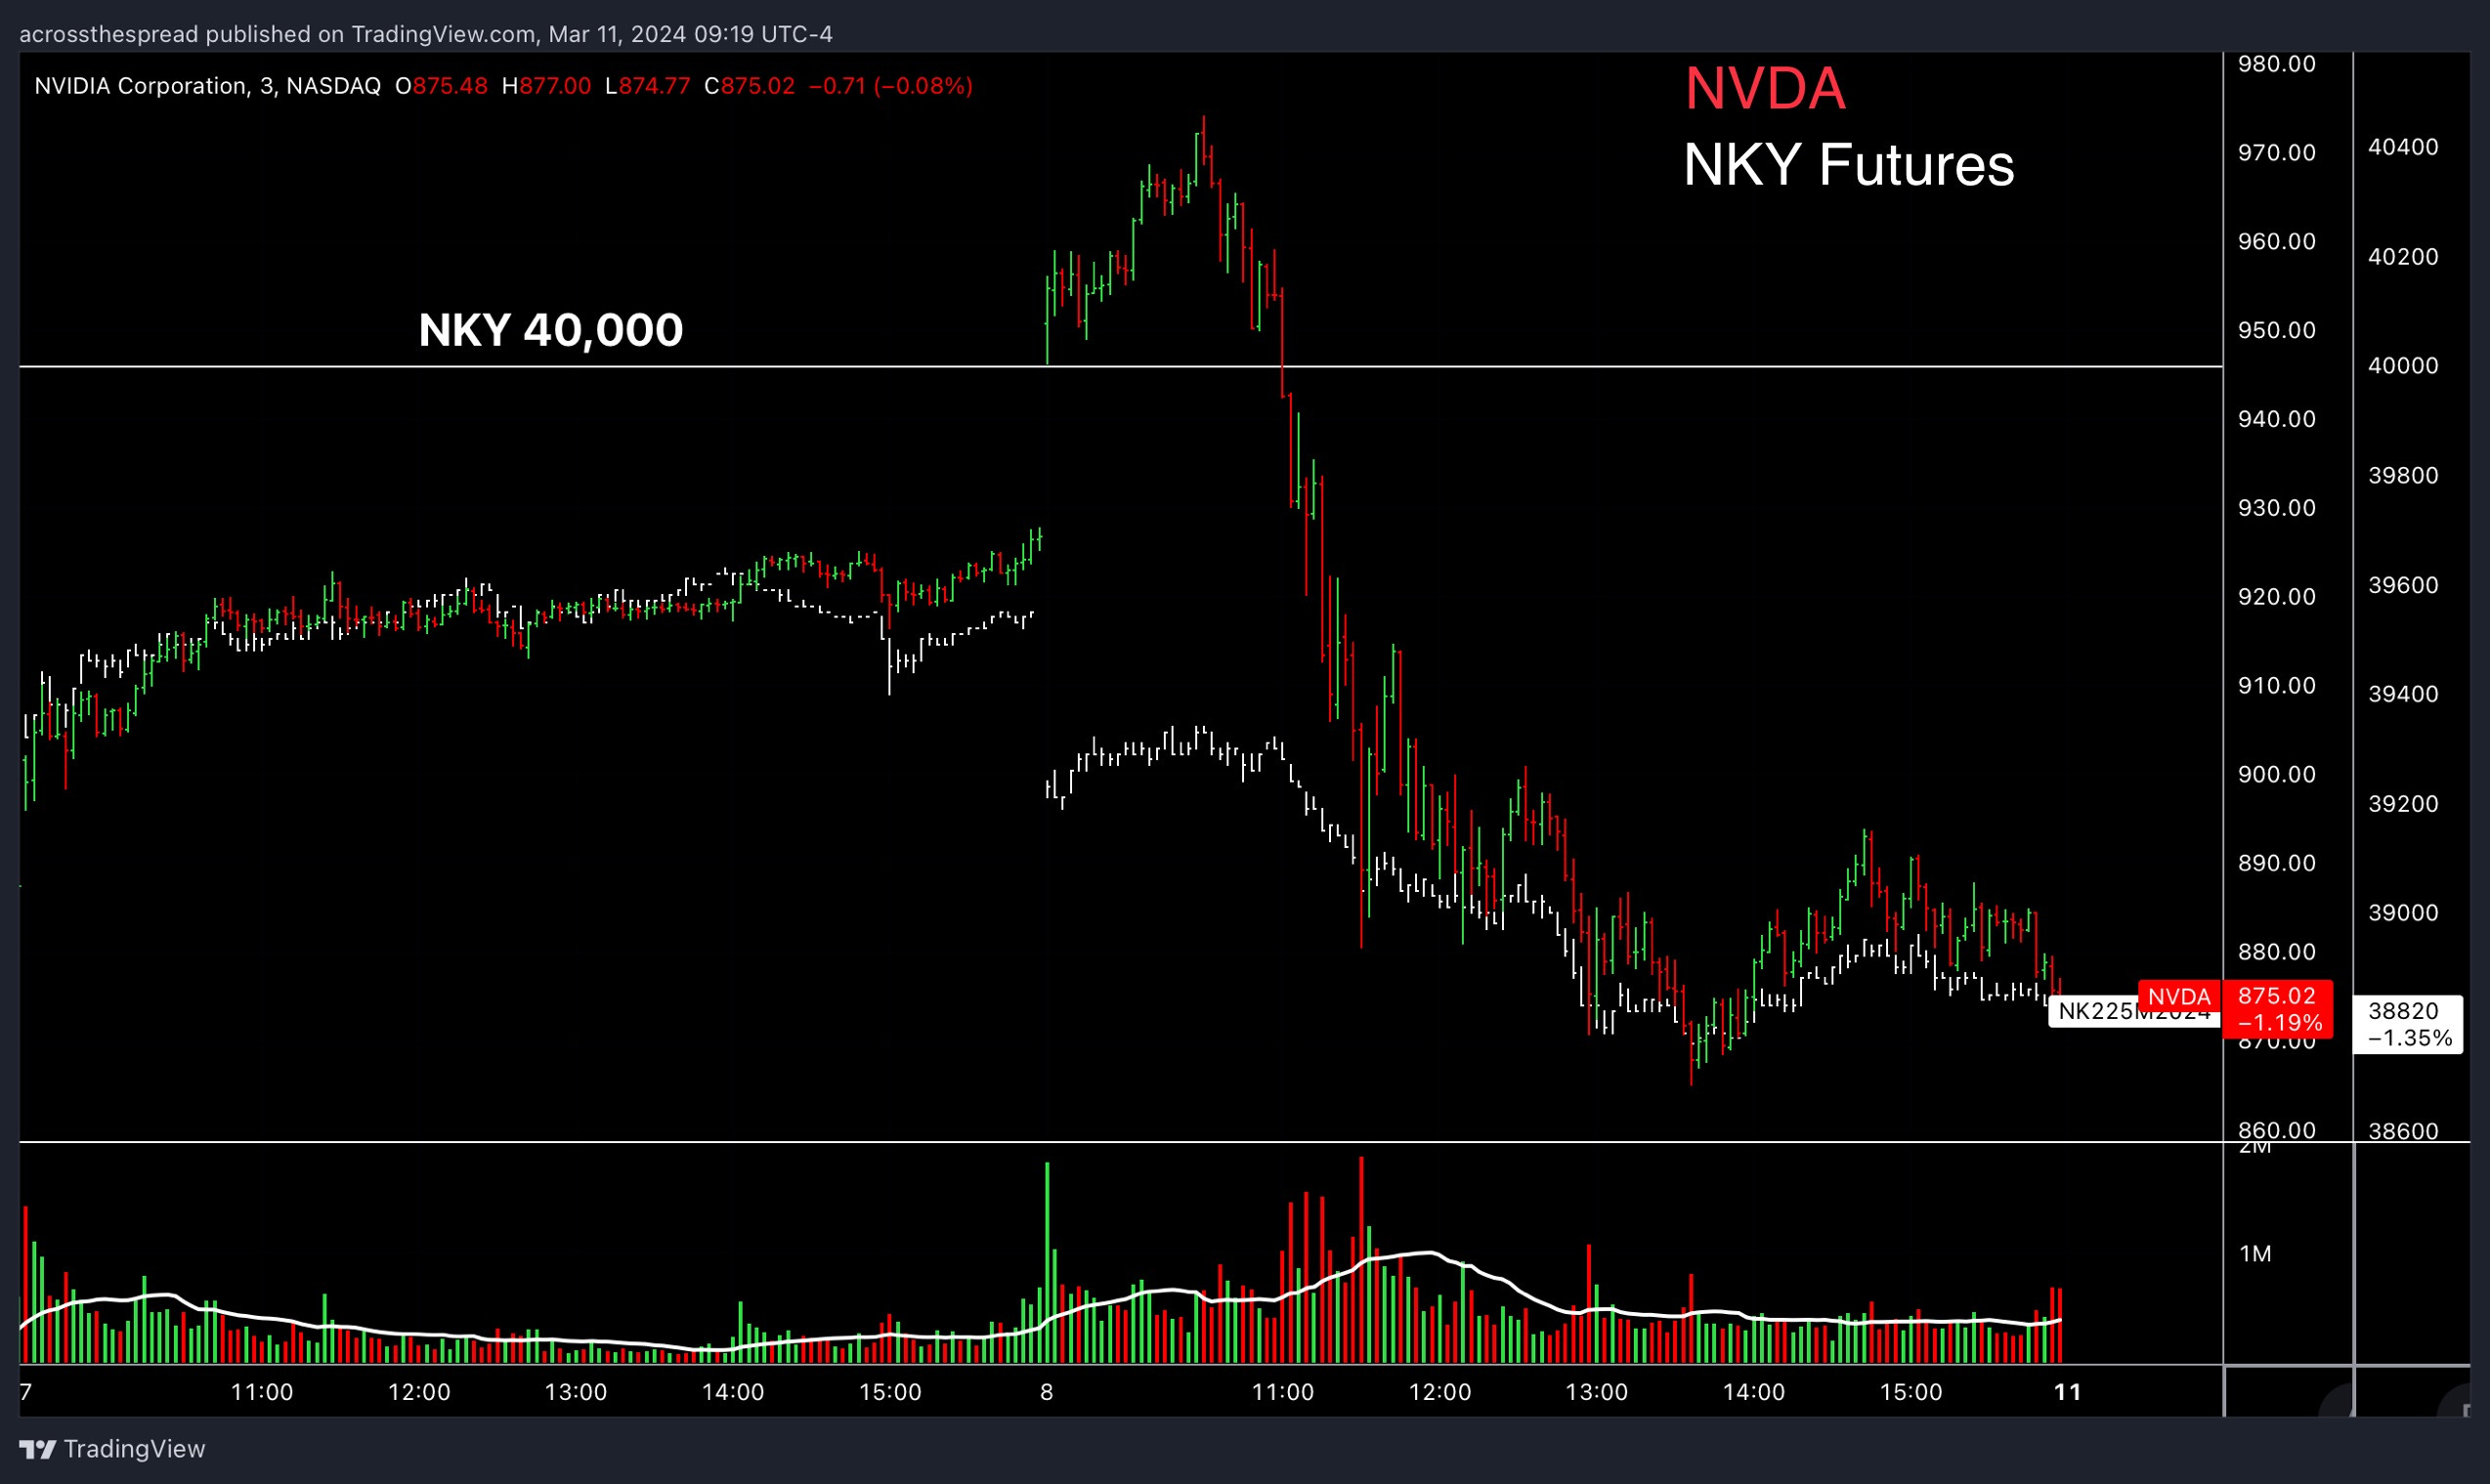
US jobs data may have spiked the market at open - but as long as NKY’s relentless runaway upside momentum is done with for now, the fat lady sings on NVDA’s blind upside momentum as well.
If we zoom out bigger picture, and use a NKY Futures chart with NVDA overlaid on top (as opposed to other way around for the previous charts, thereby showing what NKY futures are doing inside and outside US market hours) - here’s how NKY futures vs NVDA look year to date:

NKY started January at ~33k. By mid-January, NKY was up +11% to nearly 37k.
The one month between Feb 8th (last trade date heading into Feb monthly SQ) and March 6th (the eve of March quarterly SQ last trade date), NKY rallied another +12%, breaking its 1989 bubble era record high (with a helping hand by NVDA earnings release hours prior), to then printing a 40k-handle, for a +22% surge in the first 10 weeks of the year. To THEN flipping back and forth from above and below 40k.
Comparing notional trading volume month-on-month between February vs January of this year: single stock trading was up +20%, ETF trading was down -12%, NKY mini futures was +20% and NKY options trading was +50% month-on-month from Jan to Feb. All of this newly released market data from JPX reflects of my ongoing commentary through this NKY bull market surge.
NKY detached from the TOPIX index as semiconductor heavyweight index components were heavily bought from the bottom up, while options on index futures (and not index ETFs, levered or otherwise) drove the NKY from the top-down.
NKY 40k was/is not only a resistance, but prior to being a ceiling, it served as a magnet that ripped the index higher, into Feb SQ, and then March quarterly SQ. This is market structure, wide breadth, and index trading dynamics with specific price levels at play and tangibly observable activity.
What/where is the equivalent explanation behind NVDA’s underlying price action? Specific levels, volume, volatility, even something simple like a unanimously recognized ceiling of significant resistance level (which I guess would be the $1k/share stock price that would equate to to NKY → 40k - but NVDA $1k hasn’t been hit yet and has a bit more to go.
My point with all of the above is - NKY vs NVDA, both have had insane rallies. And they’re currently correlated - and it’s NKY that is moving to MARKET FUNDAMENTALS (aggregate green and red blinking ticker forces). But NVDA? Nowhere near as adhering to the “laws” of market fundamentals. NVDA shares are trading on WAY out the money calls expiring frequently, among other things. NVDA is running around like a chicken with its head cut off. And because of this utter lack of rhyme or reason to price action and trading activity - NVDA, the mag 1, follows NKY, where active liquidity, along with “order and structure” currently live.
It’s mid-2023 all over again in DM equity markets: 2 out of the 2 market themes out there, Long Japan and Long A.I. are getting hit. And the rest of the markets don’t really matter (sorry, if it’s not where the active capital is, it doesn’t really matter).
But it makes sense that NKY would drive NVDA (and thereby SPX) - because once again, who or what is driving NKY? Foreign (American, European, and completely unrelated but still significant- Chinese) capital. It’s all foreign money, spread out into thousands of single stocks across Japan - not ONE single A.I. stock that “represents” the rest of the S&P499.
Keep reading with a 7-day free trial
Subscribe to Across The Spread to keep reading this post and get 7 days of free access to the full post archives.