


Trump Tariffs: What to Watch When Asia/Global Markets Open
Mex Peso & CAD vs USD are not the best market barometers - watch CAD/MXN cross, Japan TOPIX Autos Sector, and gold to potentially rip. Cross asset market price action observations.

Every trading day begins in Asia - from the Tokyo global FX session open, to Japan AM market open on this region of the world’s largest, most liquid and most international cash equity market that sets the tone for Europe and then finally US trading hours.
And when market consequential developments over the weekend - like this…
…it makes Asia Monday market open (Sunday evening US) particularly critical in tone-setting, because such headlines that hit during market trading hours have the algos immediately jump all over it - whereas weekend headlines allow for the next opportunity for market reaction to slow down to human pace (though still mostly algo flows as well).
Other than Canada’s retaliatory measures of 25% on $155 billion on US goods ($30 billion starting Tuesday when US tariffs on Canada kick in + $125 billion in 21 days thereafter), we still don’t have details for any of these tariffs on, and from Mexico and China- let alone if there will be actual follow through without alteration, let alone retaliatory measures (and then further retaliatory measures).
Furthermore, what was just announced by the Trump administration was already well known, and made explicitly clear down to the date for some time now.
What’s uniquely difficult about the “efficiency” of markets for this particular moment is that we simply don’t know to what degree publicly known information is actually priced into markets - because a significant proportion of capital simply did not (and still does not) actually believe that Trump would go through with his clearly stated tariff measures.
How many times have we all heard the following regurgitations of Trump strategy analysis:
“This is a bulwark / Trump’s starting point for negotiations, he doesn’t really mean (insert large $___ amount figure they’re in denial of).”
“Take Trump seriously, not literally.”
…and the like.
Combine that with a tariff threat on Columbia that lasted as long as a round of Korean martial law, and we get markets that have clear and widely disseminated information at hand, but do not price said information in as a collective whole - it’s immeasurable how much “disbelief capital” that is sidelined out there, which now needs to rush in (or continue to wait). Or whatever combination and pathway this extremely messy market pricing-in undergoes. Welcome to Trump 2.0. Throw your fucking academic models on “fair value for the 10Y yield” away.
So, Asia markets open will be a reflection of markets that really aren’t operating on any materially new info. That said, how much of that info has already been priced in/not is what the question is.
One might think that Japan markets aren’t a relevant barometer in this situation, given that these tariffs don’t include Japan directly, and are measures borne out of matters around illegal immigration and drugs crossing US borders - which Japan also has nothing to do with. However, Japan trade is not only highly exposed to manufacturing and then selling cross-North American borders (namely autos and auto parts), but its precisely because Japan isn’t a part of this border fight that actually makes Japan market behavior and reaction to be a more “pure” barometer reflection of global financial and economic impact - as the core issue and decision making is completely out of its hands, but is subject to helplessly suffer the economic consequences nonetheless.
With an uncertain amount of uncertainty still before us, I can’t give a market directional view with any conviction (though I will do so later).
Instead, I’ve just mapped out the prevailing market setup and cross asset behavior via a series of charts and observations of green and red blinking tickers, in order to help narrow down and identify what to watch, as well as what to not put too much focus in.
FX markets are clearly the best asset class for observing trade wars within markets, as FX markets are uniquely and inherently long/short pair trades between two sovereign currencies for zero sum, rather than standalone financial assets like equities, bonds, commodities etc. Observing
USDMXN and USDCAD: The two blinking tickers that aren’t as useful in cross-asset market reading as much as one would think.
Obviously I’m not saying that USDMXN and USDCAD somehow “do not matter” - they certainly do, and again, I’m strictly referring to relative usefulness in getting a read on broader cross-asset markets.
The following charts are the different FX pairs, each of which are overlaid against NDX futures / SPX Eminis futures ratio (in purple), which I use to get a broader equity market read.
The reason I’m using NDX/SPX ratio chart, rather than a straight SPX or NDX chart, is because of the recent DeepSeek market hit that had visually distorted index price action - as it was a fundamentally sector-specific impact, but that sector happens to be a handful of names that comprise the top quartile of the US equity market. So, by charting it out as a ratio of SPX vs NDX - this is a way to structure it such that it can lessen the presence of Mag7 volatility to some extent (SPX/NDX ratio is essentially a “Long SPX / Short NDX” - or what the megacap tech-negated S&P500, or “S&P493” is reflecting in market behavior).
Here is dollar Mex peso (inverted: red↓ = Mex peso↓) vs NDX / SPX futures ratio.
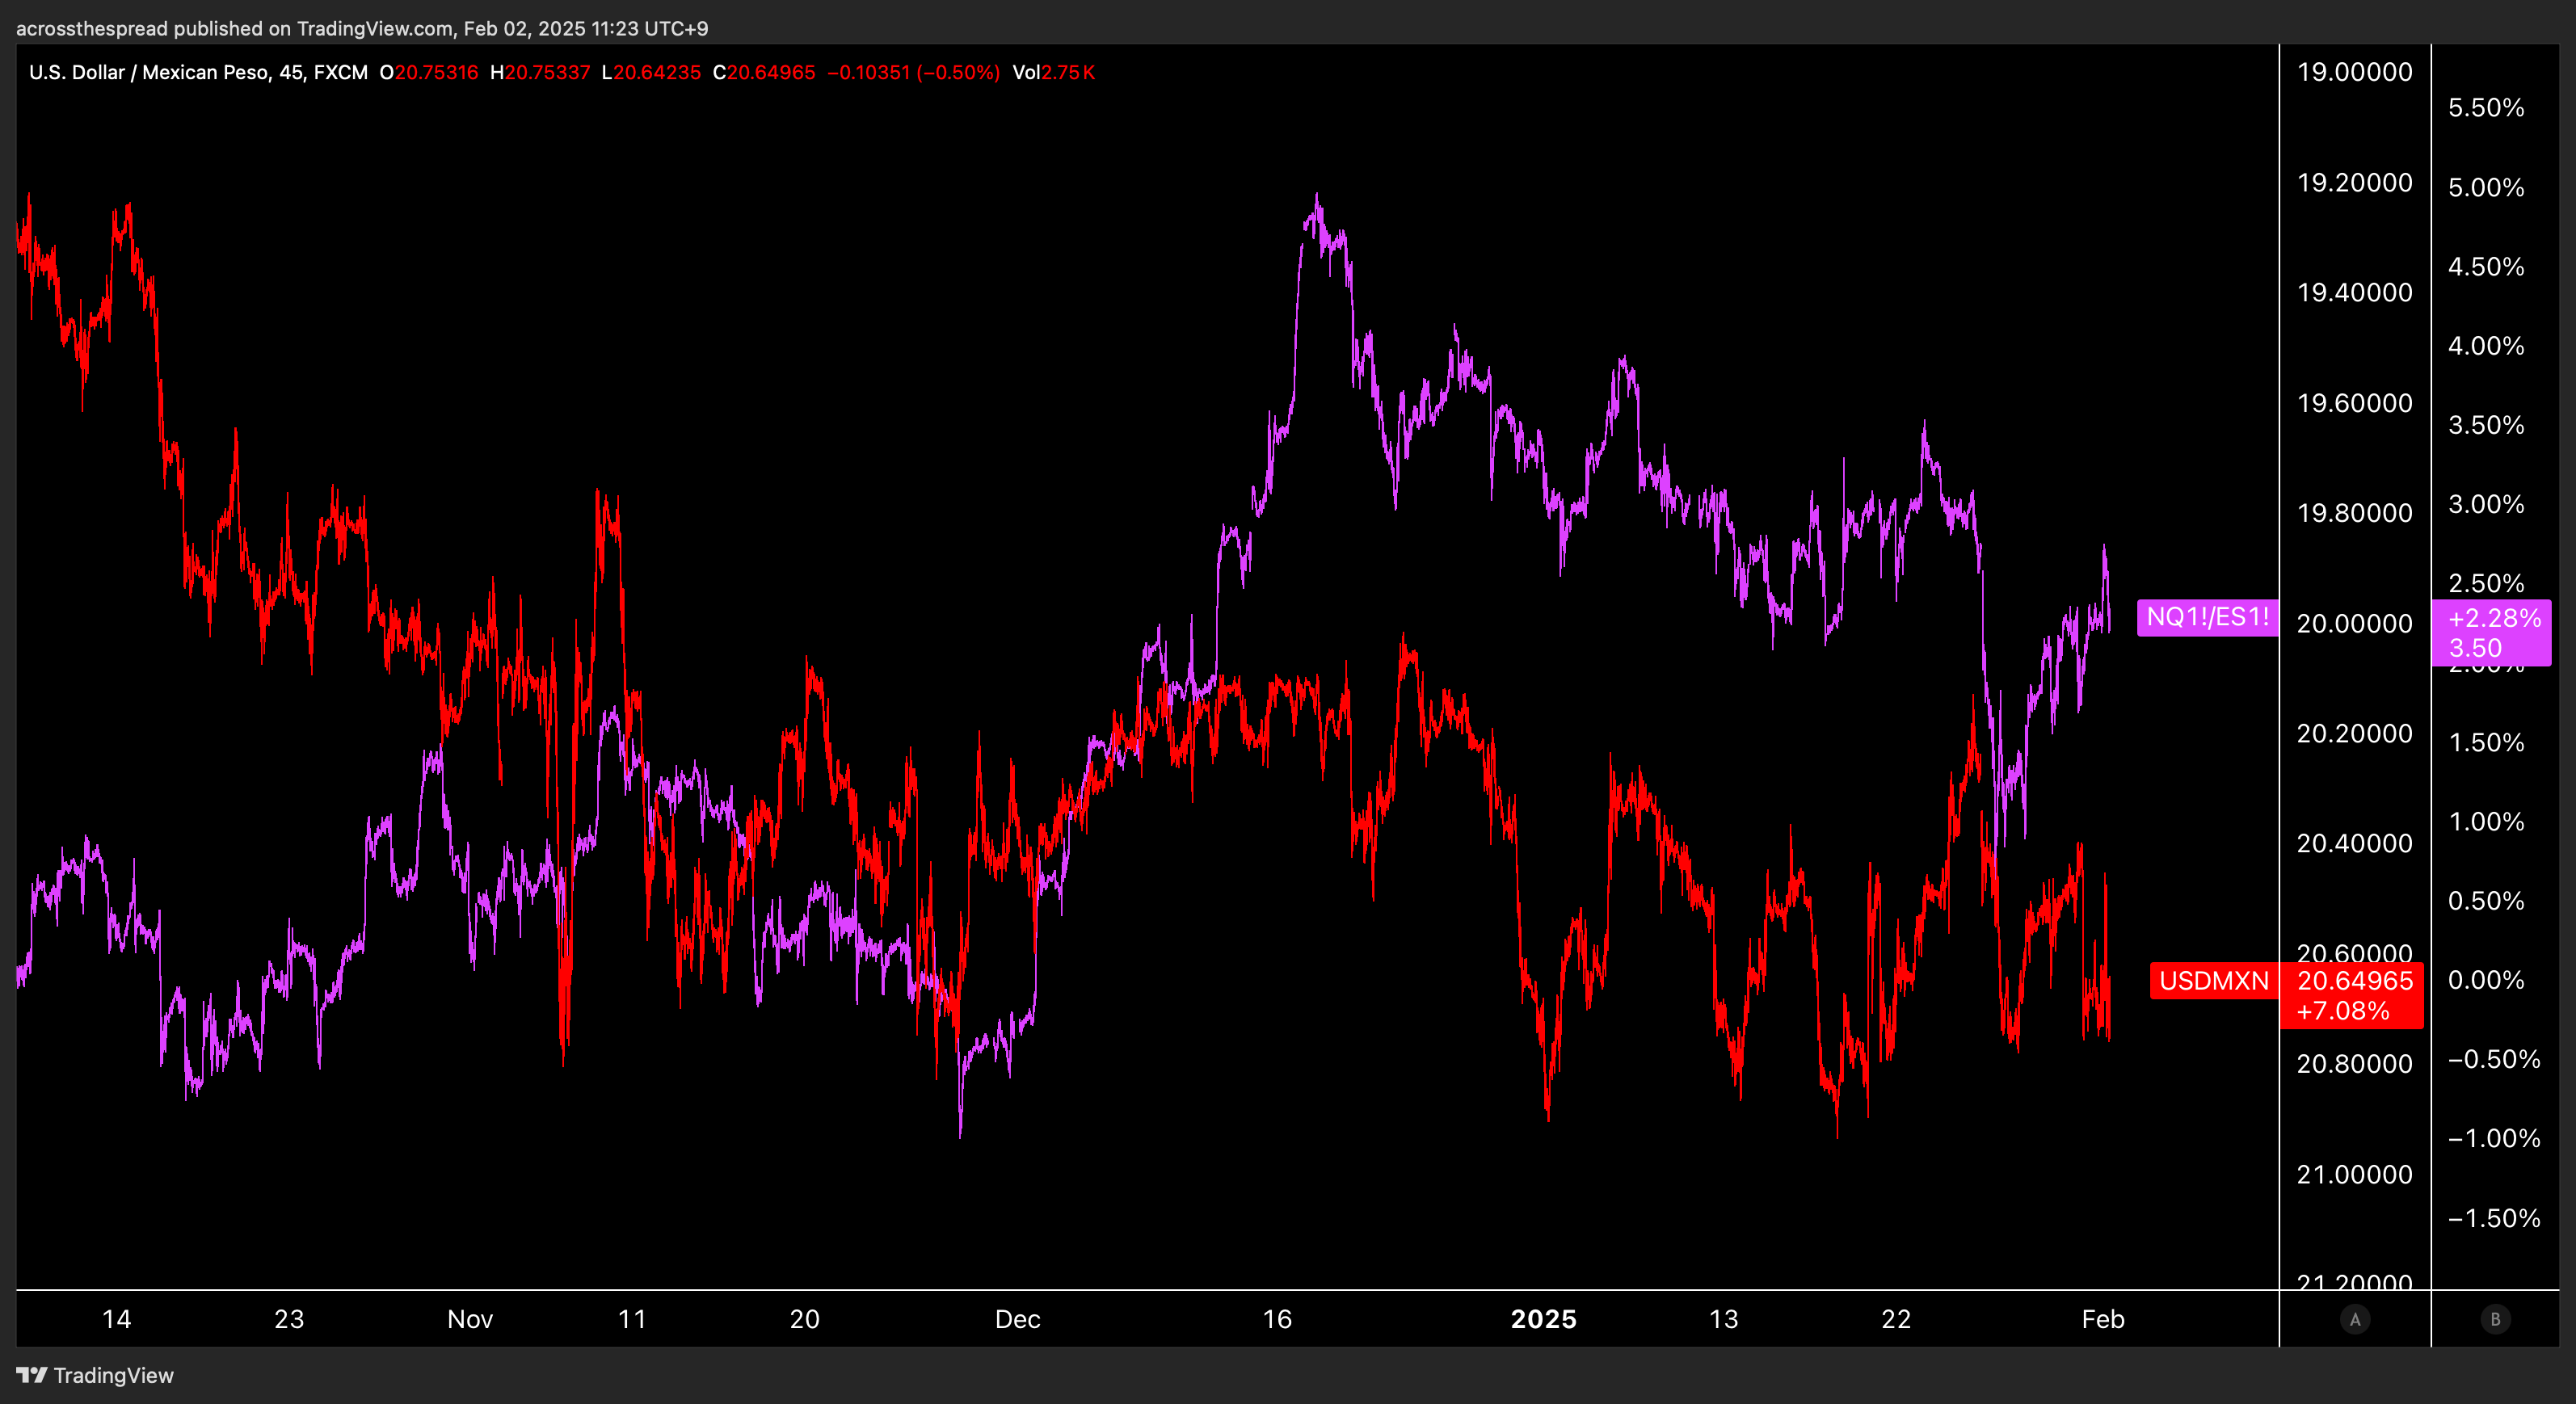
Really not much directional relation between MXN and US equities in the above time period capturing pre-election ~ current.
Here is the same NDX/SPX ratio, but now vs USDCAD:

Not much relation here either with Canadian dollar vs US equities - the seemingly parallel uptrend in the first ~⅔ of the chart isn’t so parallel, but even if it were, the most recent few trading days at the end of January, when these blanket tariffs on Canada with a set start date emerged - this period does not show any relation between CAD/USD and US equities.
So, USD vs Mex peso, and US$ vs CA$ themselves (i.e. Mexico and Canada trade wars) don’t seem to be reflected in equity markets.
But - I then took USD out of the picture and simply looked at the Mex peso / Canadian dollar exchange rate CAD/MXN - and lo and behold, the CADMXN cross, which fundamentally has really nothing to do with US equity indices (as is reflected in the pre-Nov election period of the chart), actually match up fairly tight in price action over the course of December and January.
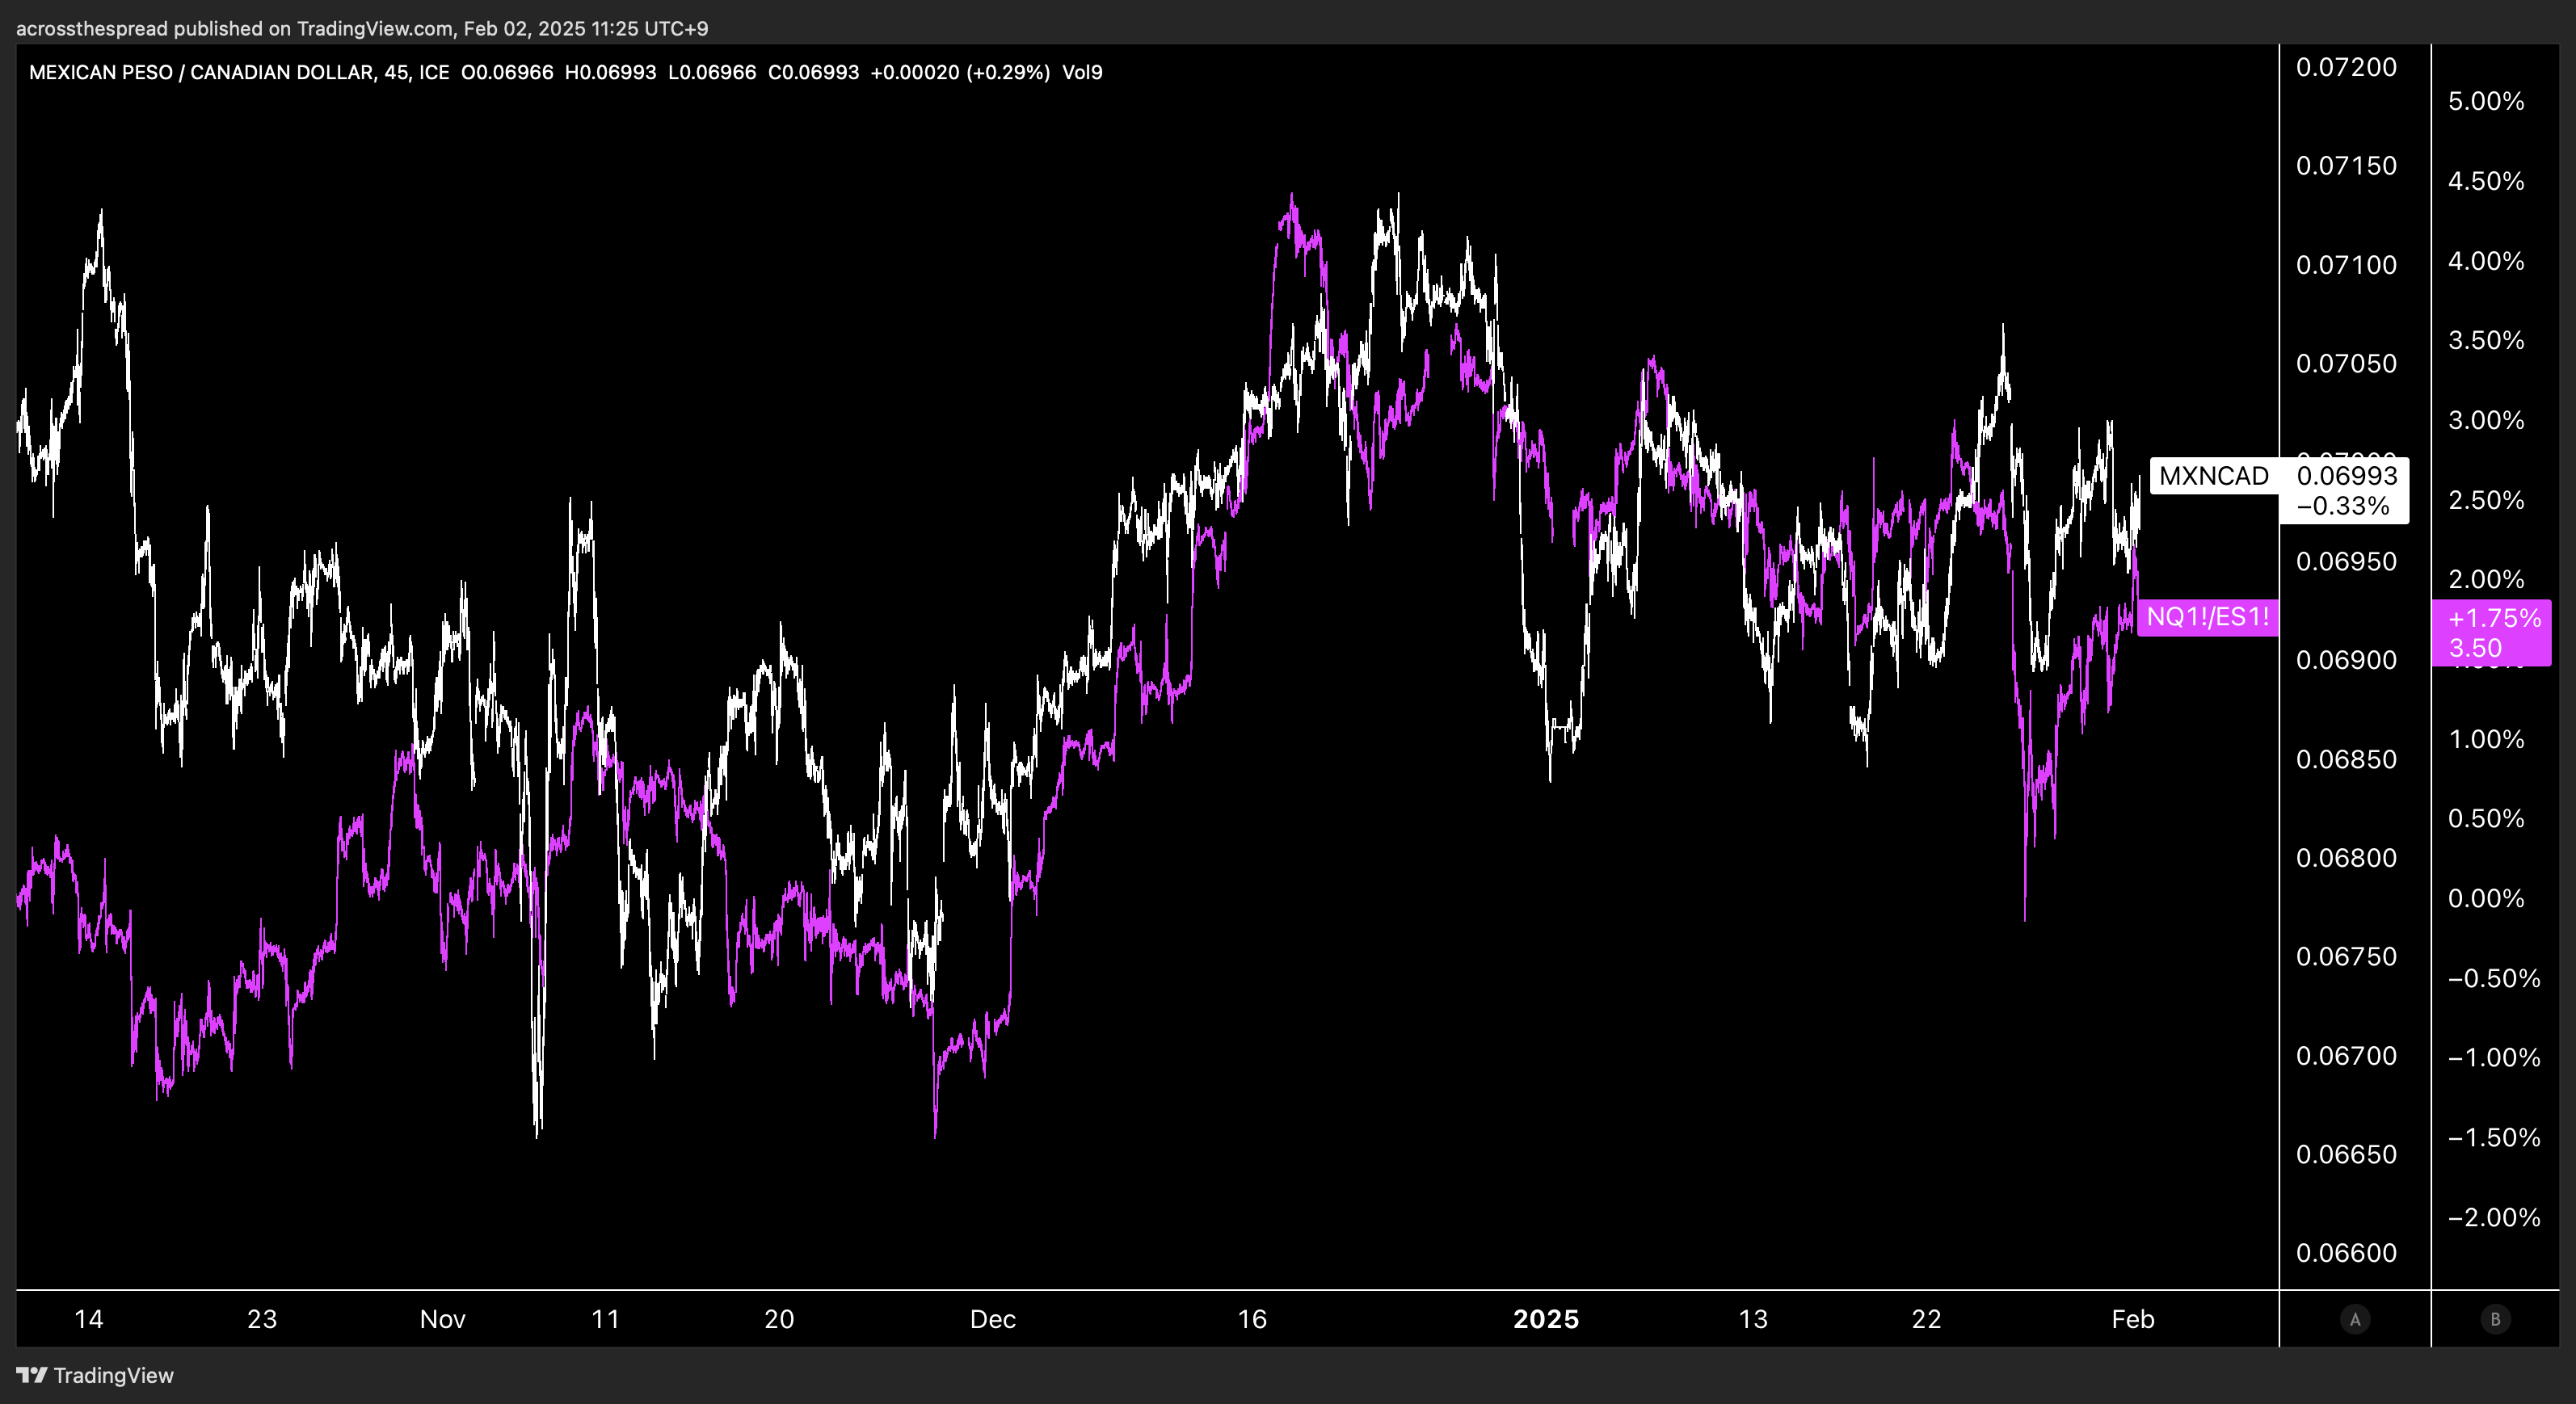
CAD/MXN - this is your FX reference for equity markets’ relative pricing in of tariff related matters - so, now that Trump has finally and actually announced these tariffs, let’s now see if this tight correlation still holds, and if it does, it can provide for the explanation of equity index market behavior in the immediate term ~ short term, or even longer.
Keep reading with a 7-day free trial
Subscribe to Across The Spread to keep reading this post and get 7 days of free access to the full post archives.