L.A. Wild Fires Are Burning The Bond Markets: An Alternate Take On Why Global Yields Are Surging
Japan's Big 3 General Insurance Co's have direct exposure to pay huge and growing fire claims in California, and are liquidating their portfolio assets to do so: USTs, UK Gilts, equities and more.
Basic Premise: The big three Japanese general (non-life) insurance holding groups- MS&AD Insurance Group, Tokio Marine Holdings, and Sompo Holdings, each of which have massive global footprints via networks of subsidiaries and find themselves with direct exposure to LA burning, (and whoever else on the smaller scale) are fire-selling (no pun intended) their largest and most liquid securities, such as US government bonds and maybe even stocks (recall major indices losses on Jan 7th, and note that NKY index is down -4% over 5 straight days of losses since Jan 7th) liquidating their most liquid portfolio holdings perhaps even in a forced manner much like a margin call - in order to meet their growing claims.
And as this LA fire continues to rage on and the Santa Anna winds continue to spread destruction, they’re recalculating their liquidity position on a real time basis, and selling more as needed - because the worst fire disaster in US history, empty fire hydrants and damage costs that only grow and grow - all of this is likely not in their risk modeling. So they need to raise cash, and (as Tokio Marine’s CEO just stated) are paying out claims now, and as fast as possible. And that won’t be done until it’s done. So, the ongoing burning of LA is what we are seeing in yield curve bear steepening and weak equities, the weakest of which are Japanese government bonds and Japanese equities.
Greetings friends, happy 2025. Apologies for the delayed release of my 2025 cross-asset market and policy outlook project, for which I’ve been working in-depth analysis and comprehensive commentary on. Unfortunately, I’ve also seemingly had a wonderful cocktail of simultaneous episodes of burnout + sick/illness + traveling cross-hemisphere + jet-lag, all of which has admittedly and uncharacteristically been a bit tough to thereby film and produce this in video format, as had originally been intended. But fear not, for I am still very much fighting my way through to just release this in written format in short order first, come hell or high water. It is a critical, big picture assessment of the overlooked state of global markets from a my unique perspective spanning 20 months prior and 12+ months looking forward. I will also leave an in-depth preview hitting a few of the topics (UST yields, USD, US equities and BOJ) at the bottom of this very note.
But in the interest of both real-time market urgency, as well as to avoid shoving “unrelated” content into the ‘25 outlook piece, I had to put the 2025 outlook (re)writing on a brief pause, in order to share this as a separate piece here: an alternative take on what I believe is what is going on with these sharp rises in long dated bond yields currently underway - and by which of course I characteristically mean: what ELSE is going on in markets that is impacting, but is still somehow being vastly overlooked in plain sight by the masses, and for you, the small informed minority to be aware of.
On January 7th of last week, I boarded my non-stop flight back to Tokyo, departing LAX (Los Angeles International Airport) around noon Pacific time. By the time I landed at Haneda airport a half-day later (and a full calendar day forward), Los Angeles was engulfed in flames. Concurrently, sovereign DM debt markets were also on fire, as long-dated yields everywhere were surging - albeit to an incomparably far less significant degree.
These two things - the outbreak of multiple infernos devastating L.A., and major global DM bond yields rising sharply (and even broad equity indices selling off), are all indeed interrelated phenomena. At least, far more connected than is being even slightly noticed out there. This article will go through this (additional) overlooked market perspective.
UST, UK Gilt, and JGB Yields
The long-end of the US and UK bond markets seem to be in front and center focus for market participants and talking heads - and in an oddly over-dramatic and almost panicked tone at that, for which I don’t understand why this level of hysteria is happening. Particularly (or perhaps, precisely) because nobody seems to have any real idea or rational explanation for why the 10Y ~ 30Y tenors on DM government bond yields are rising the way they are over the past week.
The widely parroted narratives for the US yield moves and the UK yield moves higher are idiosyncratic in their own respective ways, but are by and large equally stupid.
“US yields are surging because of worries of Trump’s inflationary tariff and tax cut policies.”
“UK yields are surging because of Chancellor Rachel Reeves’ budget unveil, reminiscent of the ‘22 Liz Truss mini budget bond market blowup.”
No. And no.
To be fair to the latter- some voices also cite that global bond yields are on the rise, not just the UK’s - which is indeed correct. Here’s Chancellor Reeves herself in response:
“There has been global volatility in markets. I don’t really believe that it is reasonable to suggest that the reason why bond yields in the United States, in Germany and France have risen is because of decisions made by this government. I think the honourable member opposite should just get real.”
I agree - not that there’s anything to really “agree/disagree” with, as this is just a very clear and easily observable straight forward fact - long-end DM yields everywhere have been on the rise, and I seriously doubt that an ex-UK global sell off in government bond markets are currently underway and picking up steam in the past week because of Rachel Reeves’ non-Armageddon budget, which was unveiled all the way back in late October, pre-US elections.
Equally stupid an explanation for global bond yields jumping in the past week is the “Trump tariffs and tax cuts” thing - and the reason this is equally stupid is because (putting aside that Trump hasn’t actually done anything in office yet, as he isn’t even yet in office - but fine, let’s just go with pricing in all of not-yet-President Trump’s rhetoric at face value), again, Trump was elected in early November. In other words, markets are not NOW “reacting” to Reeves/Trump two months after the fact.
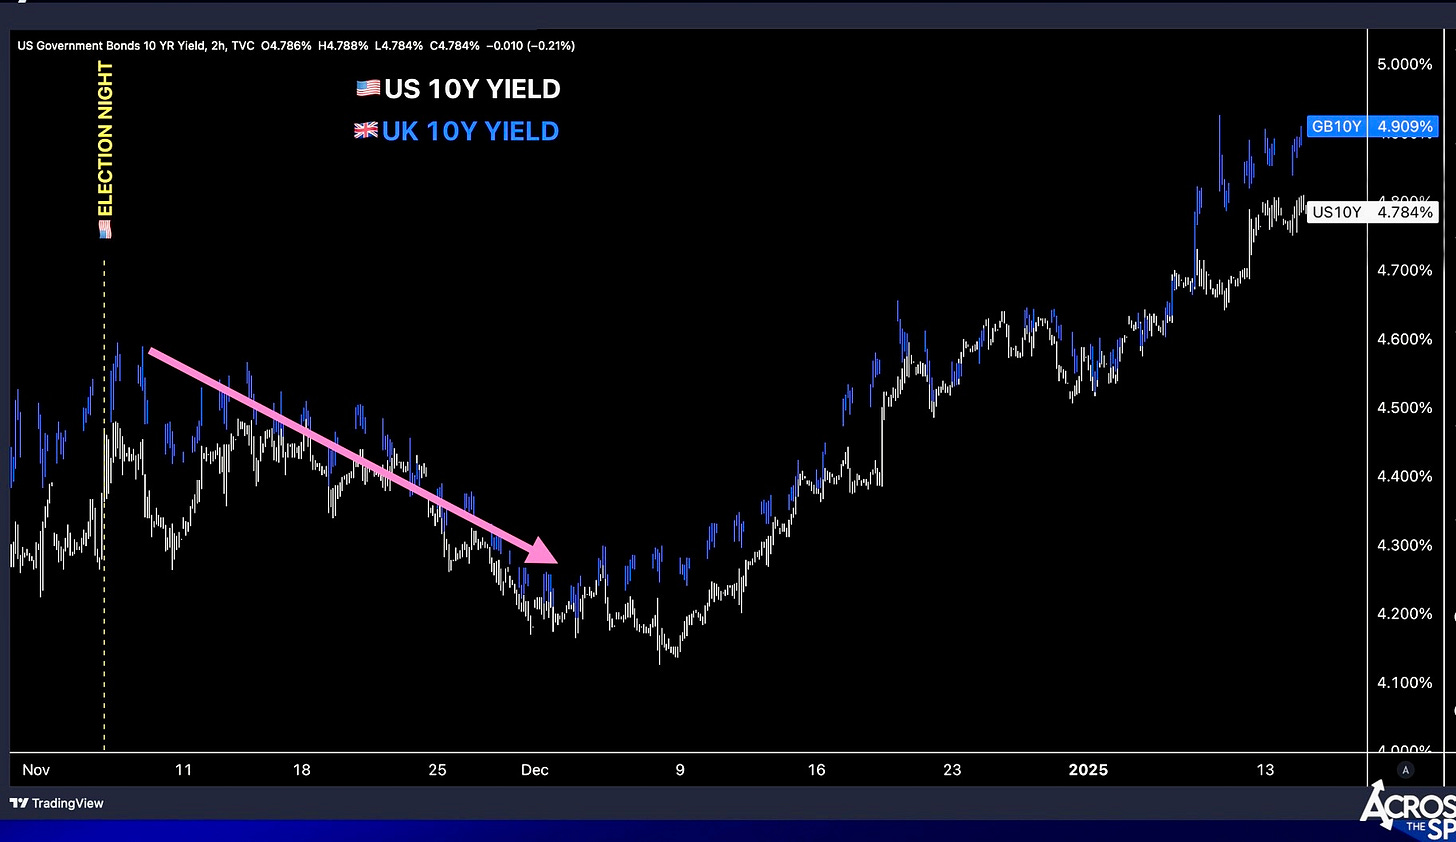
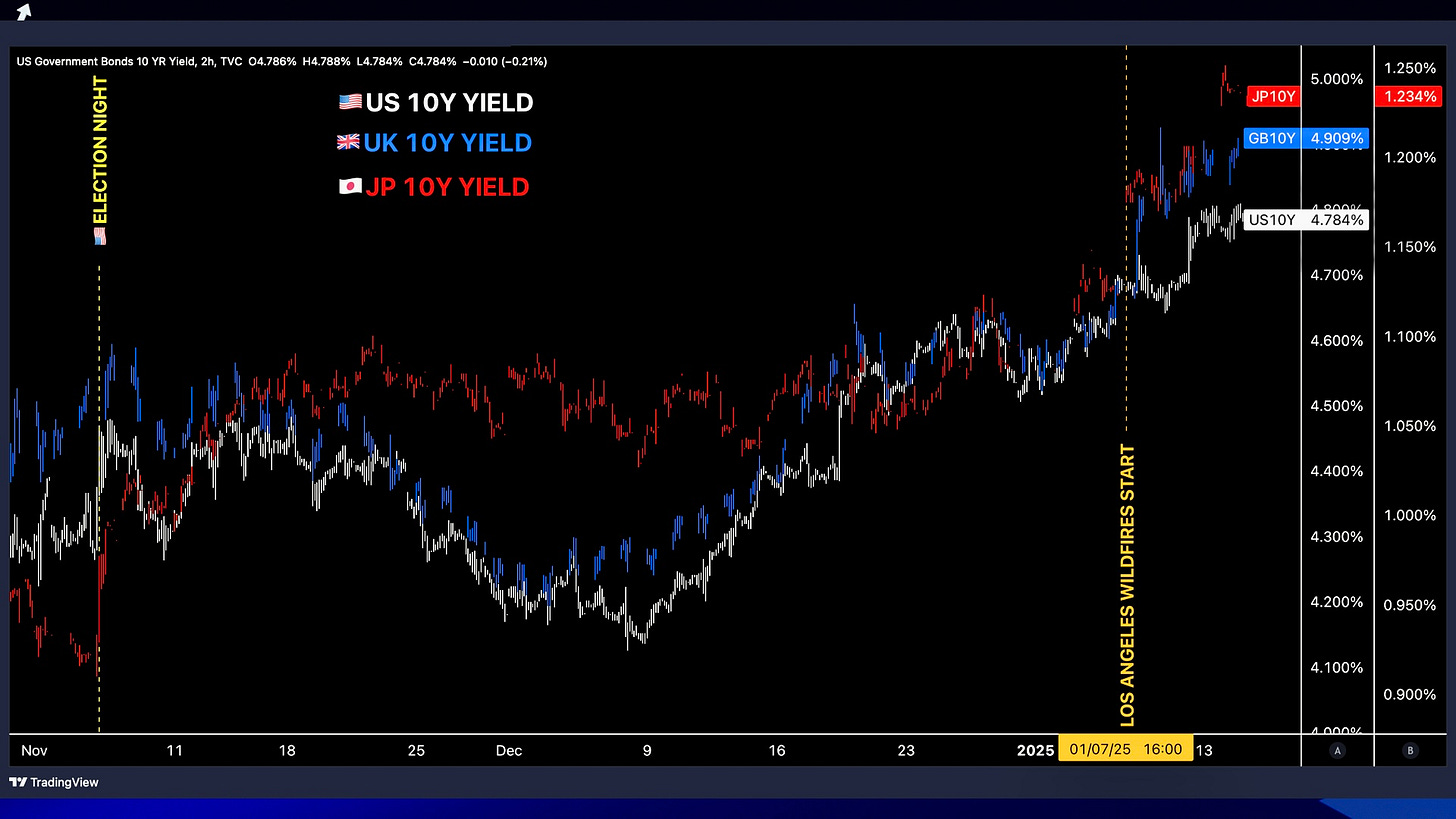
Here’s a single and simple chart that immediately dispels both the UK and US “fiscal / inflationary policies” being realized in markets with a 2 month delay:
Post-election, bond yields FELL, and fell to levels LOWER than PRE-election. And then subsequently rose in an orderly manner back to election levels, then flatlined for the last two weeks of the year, before jump-starting again last week. That is not how market behavior and catalyst triggering works.
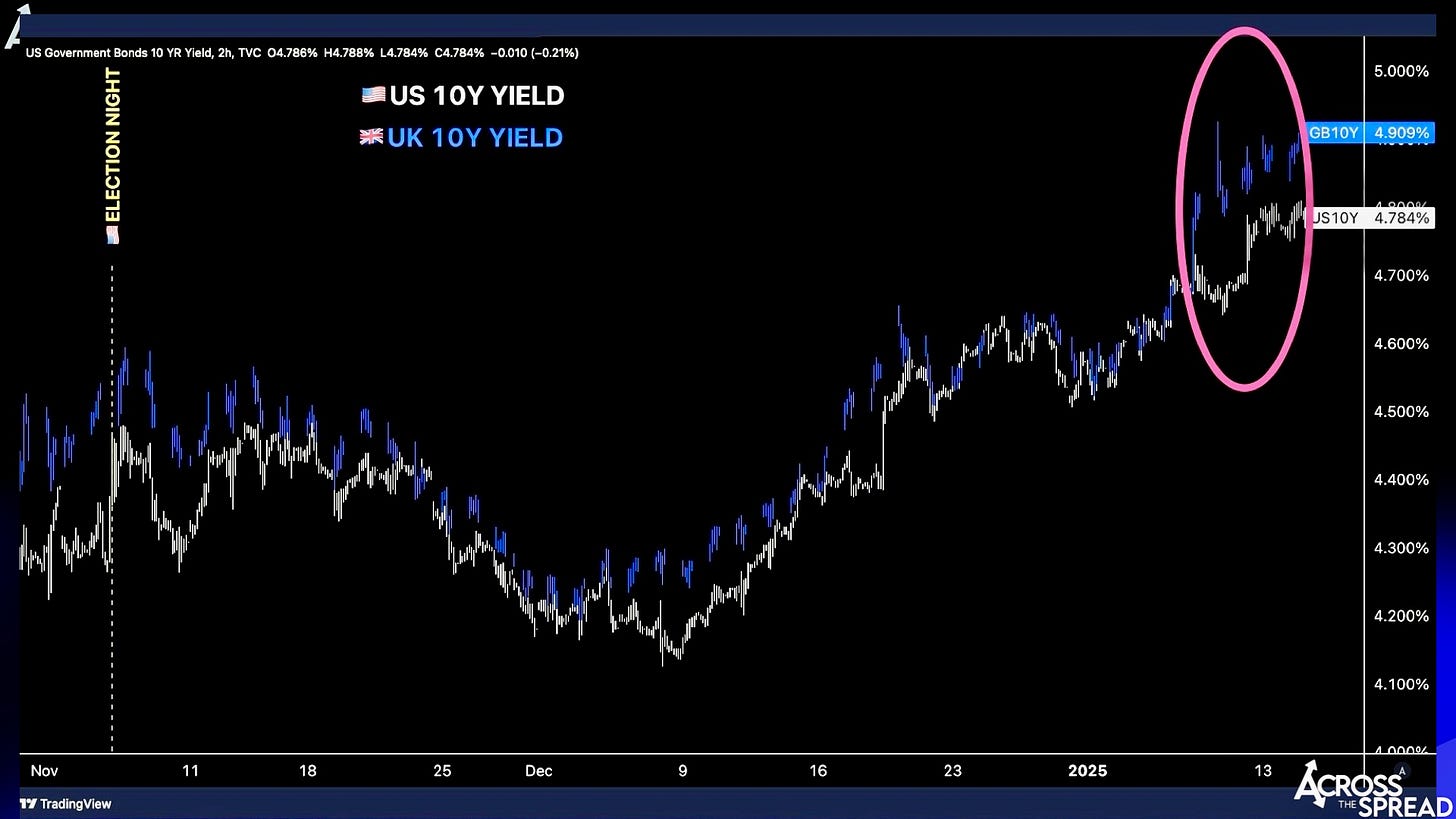
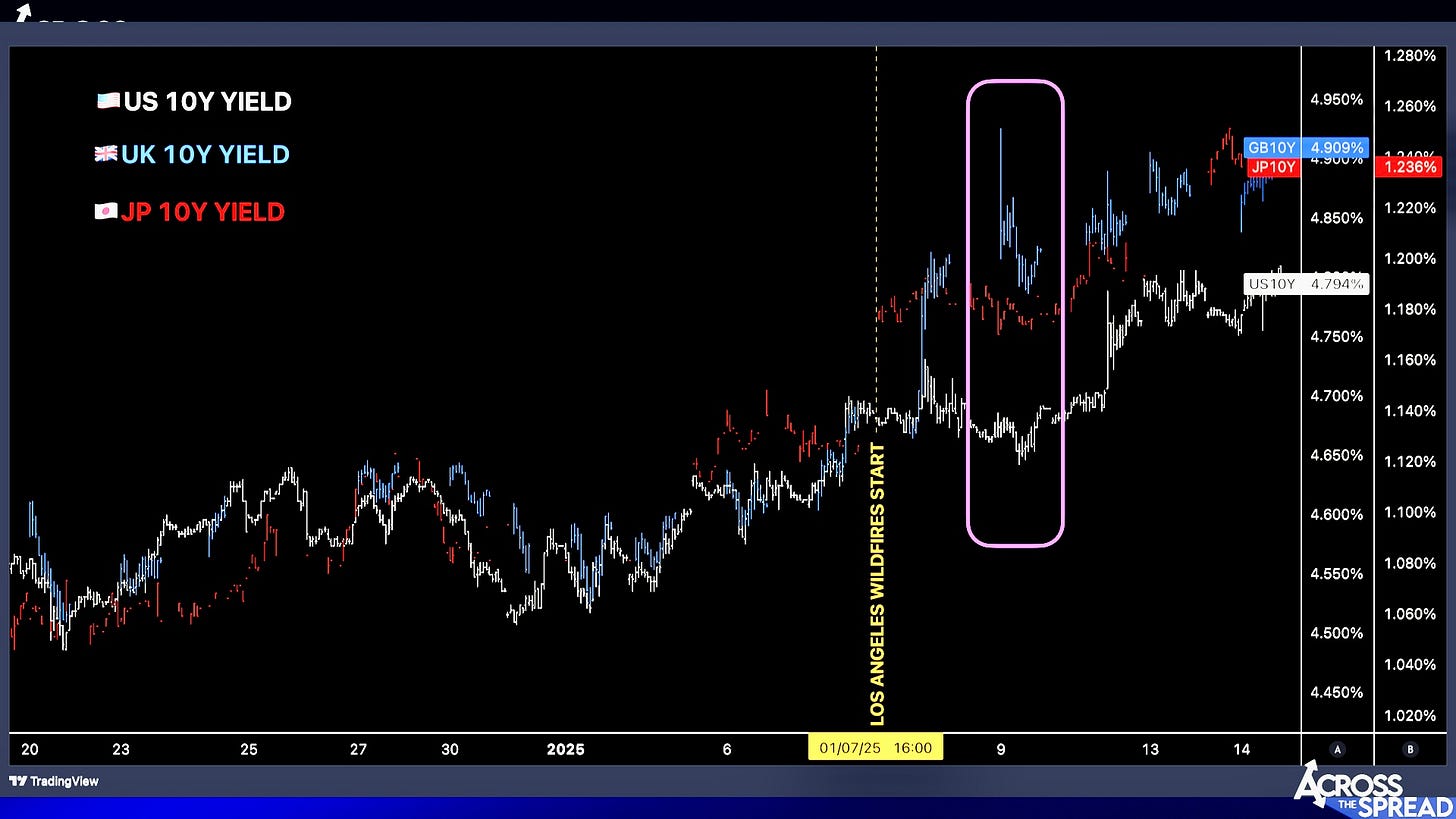
Now, here is the same chart again below - and note that both US and UK 10Y yields are sharing the same y-axis, so they are both maintaining the same in actual nominal yield levels. And here, I suppose the partial acknowledgement / subsequent brush-off of “UK yields are moving in line with global yields (and directly in tandem with the risk free US rate) - BUT, then diverged and took an extra ‘UK-specific’ leg higher over the past few days” thing can be somewhat more reasonable:
…but again, if the explanation reverts back to “…because of Labour Party Chancellor’s rubbish budget” - again: no. That was unveiled more than 2 months ago, and nothing of serious material consequence on the structure of the budget had changed since - not even the rising borrowing costs themselves that have now eaten up any cushion.
And just to address and get this far more nonsense point out of the way: the Rachel Reeves/Keir Starmer budget unveil is absolutely nowhere near the same planet as the Kwarteng / Truss mini budget unveil + doubling down political and market situation in 2022.
This BBC chart below is just… very meaningless to put it politely.
(Also, thanks for noting UK gilt cash market trading hours as a footnote of zero relevance to this chart, BBC.)
So it’s not not-yet-President Trump’s nearly decade-old and well known tariffs + tax cuts, nor is it Reeves’ extremely market-aware/sensitive budget. What it IS, nobody will ever know for sure, but what it’s NOT are the aforementioned regurgitations.
Here is what ELSE IS actually happening in the world of green and red blinking global government bond yields: Japan.
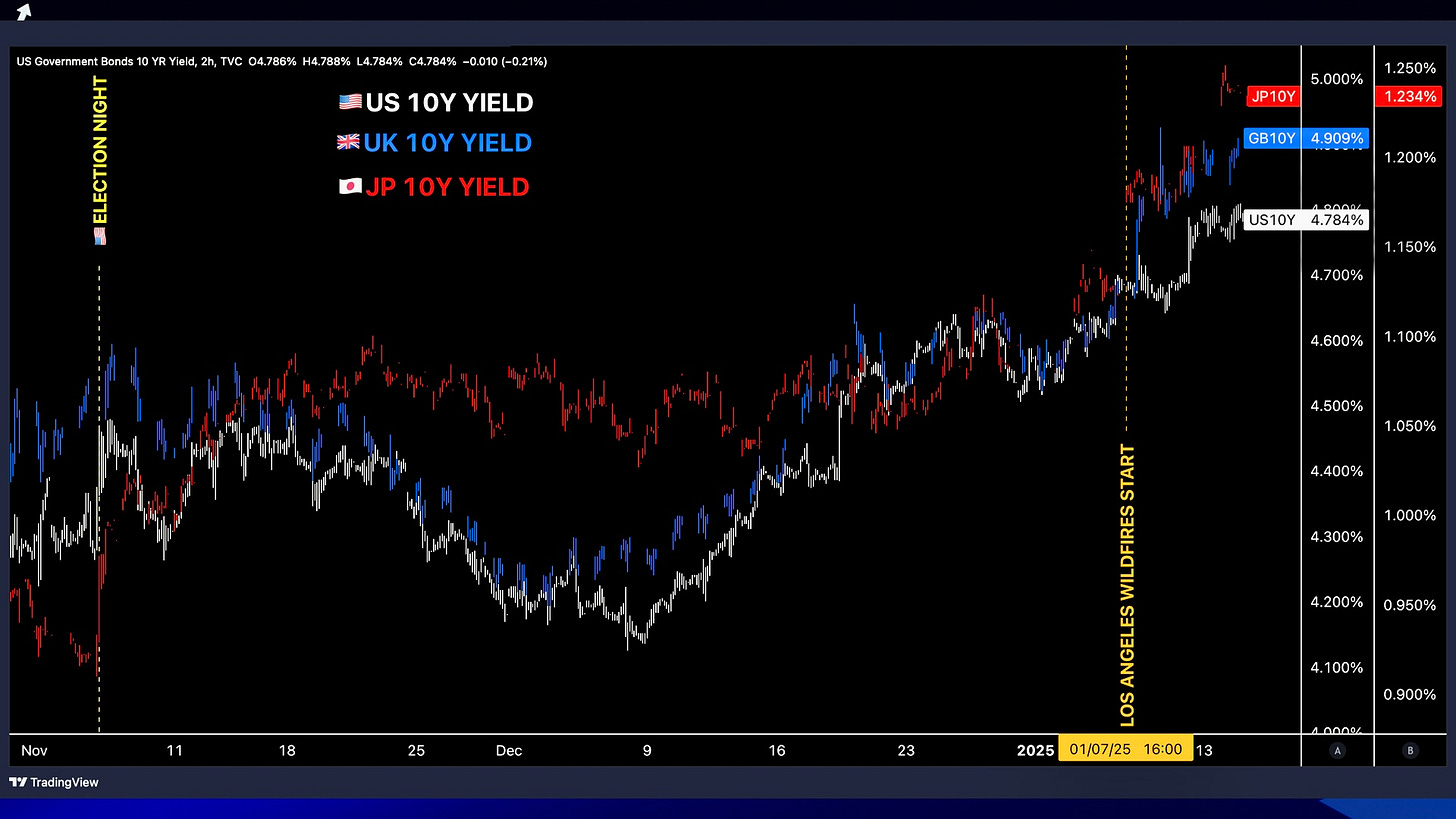
Long end JGB yields are seriously breaking out to the upside, and far more dramatically and idiosyncratically so than their US and UK counterparts are.
A few things to points to on the chart above.
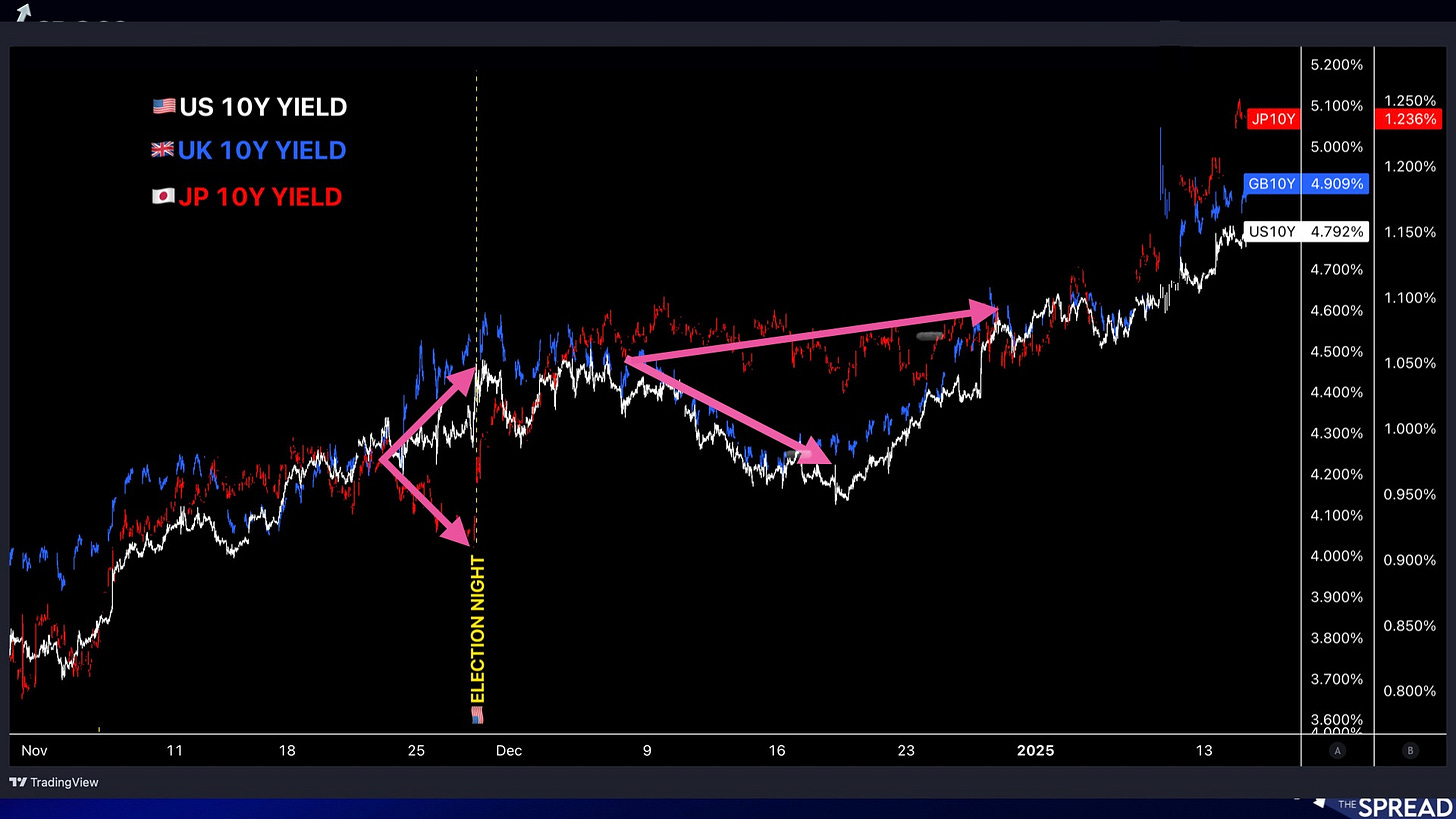
• Unlike US and UK yields, the 10Y JGB yield in red is on its own y-axis - because to fit a 10Y JGB yielding around 1% on the same chart axis as the nearly 5% US and UK yields kills visualization and analysis capability.
•But that also means that 10Y JGB yields surging by “only” +25bps, but starting from a base of sub 1% and getting to 1.25% as far more dramatic a move than US and UK 10’s moving +1% from 4.0% to nearly 5.0%. And obviously we have to also take BOJ’s YCC active yield upside suppression policy reign over many years at a maximum 1% ceiling before being discarded into context, as 10Y JGB yields hit these new post-prison highs with no explicit ceiling in place. In other words, the world’s fixed income markets are without an unlimited guaranteed floor for the first time since the QE era began, and are now trading outside the prison yard for the first time since incarceration.
•Recall that point-for-point synchronized, post-election ~2 week decline in US/UK/global yields from earlier - yeah, that downside doesn’t apply to JGB yields:
•Nor does any directional synchronization apply to JGB yields in the immediate pre-election period either:
…as previously discussed in depth in my previously released election market coverage video series:
It has been the JGB market that has led the path for its global peers’ yields directionally - just as Japan had been at each of the major prevailing trend-reversal points over the past 2~3 years (as I will show you in the 2025 market outlook preview below). At the very least, unlike the rest of the DM yield complex, the JGB market does not blindly fall in line with the DM yield pack of Treasuries, gilts, bunds, BTPs, OATs etc and instead is the outlier, exhibiting its own hyper-erratic behavior independent of broader global price action trends. And when JGBs find some directional footing, the others tend to then gravitate towards what Japan rates are doing.
That is what we once again saw from pre-elections into year-end, to current.
Pre-elections: JGB yields break away from the pack and drop, setting it up for the subsequent election day vertical surge that began and ended on either side of the 1.0% yield level, and uplifting global yields alongside election day results.
Post-elections: as the global pack saw yields level off and then decline in unison, JGB yields upheld and stayed high- maintaining its rangebound stance as the rest of the pack re-joins JGB yields back higher.
Which brings us to the here and now: global long end yields jumped in unison, breaking out of their respective whatever-decade long prior highs (and yeah- it’s not insignificant for 30Y UK gilt yields to hit ‘08 levels and what have you, but 40Y JGBs are now printing the highest levels ever since the government introduced the instrument - all time record highs for Japan’s long end).
So, back to my flight out of LAX in a soon to be on-fire Los Angeles moment - what, or rather, WHEN did JGB yields take the next jump higher? When L.A. caught fire on Jan 7th about a quarter of the way into my cross-Pacific flight to Tokyo - late afternoon in CA, or, Japan AM market open.
And when did UST, UK gilt and the rest of them surge? Yes, after wild fires broke out, but really - FOLLOWING the JGB yield move, as you can see above (chart’s time scale is set to US Pacific Standard Time). Part of this delay is due to UK gilts cash trading session opening around when Tokyo trading is closing for the day - that explains the UK yield move timing. But cash USTs trade round the clock- so long as Japan markets are open, cash Treasuries have Asia trading hours.
Same chart, zoomed in - note what moves / leads, what time of day (market open / close), and what follows.
There is a UK yield jump on open and a simultaneous pullback in US yields that carries on in an inverse correlation, almost as if it’s a short gilts / long Treasuries pair trade being executed into the weekend. Either way - among these three - JGBs, UK gilts and USTs, it’s the latter, US Treasury yields that clearly trails the other two.
So- no, this global bond yield move was NOT taking directional cues from the US - rather, the opposite. So let’s retire that notion as well.
Now take a closer look here on the 9th - when UK yields gap significant higher at London cash open - but then immediately pull back to close at its lows (boxed area):
JGB yields ending the Tokyo cash session close off its peak had stopped and immediately whipsawed UK yields back down in tandem, extinguishing what would have otherwise looked like a gilt yield runaway to the moon on momentum move.
So if JGBs are indeed still the world’s duration anchor, as clearly evident in the many charts above, then what is causing JGB yields to surge, which then triggers UST, UK and other long dated yields to surge?
First, let me be as clear as I possibly can be whenever I venture into presenting these types of thoughts (and you should all know this by now anyway):
I am NOT a single stock fundamental analyst. Let me go even further - yes I know some fundamentals on fundamentals for certain specific sectors and single stock companies, but I genuinely have near ZERO knowledge on how multinational property and casualty companies operate at their most basic levels. Yes, I used to work in institutional equity sales at Jefferies Japan for 3+ years, and yes, we covered MS&AD, Sompo and Tokio Marine at the time, but all I remember (or ever knew), was this basic notion (if it’s even true) that major disasters could be both a negative AND/OR a positive on the property and casualty insurer’s fundamentals. Negative for obvious reasons - insurance co has to pay out claims, for which it better have structured itself to be able to (via reserves, reinsurance etc), and potential POSITIVE from disasters because demand for said insurance products surge thereafter, like a steroid to top line. That, and how different countries and even states/provinces/prefectures within May or may not have different public backstops available.
So basically, let’s just go with my usual- I know how to dot-connect and figure out green and red blinking ticker behavior at a fairly decent above average level. But from here forward on the matter of Japan non-life insurers’ fundamentals, or even just basic operating procedures - you’re listening to someone who has no idea what they’re talking about.
So - again: if JGBs are indeed still the world’s duration anchor, as clearly evident in the many charts above (that part and everything preceding it- you can put faith in me for), then what is causing JGB yields to surge, which then triggers UST, UK and other long dated yields to surge?
My best guess - and again, yes, this is 100% a purely speculative, zero evidence, zero knowledge guess:
MS&AD, Tokio Marine, and Sompo Holdings (and whoever else on the smaller scale) are fire-selling (no pun intended) their largest and most liquid securities, such as US government bonds and maybe even stocks (recall major indices losses on Jan 7th, and note that NKY index is down -4% over 5 straight days of losses since Jan 7th) liquidating their most liquid portfolio holdings perhaps even in a forced manner much like a margin call - in order to meet their claims.
And as this LA fire continues to rage on and the Santa Anna winds continue to spread destruction, they’re recalculating their liquidity position on a real time basis, and selling more as needed - because the US’s worst fire disaster and empty fire hydrants and damage costs that only grow and grow are likely not in their modeling- they need to raise cash and they need to do it now, and aren’t done until it’s done.
And that is what we are seeing in yield curve bear steepenings and weak equities, the weakest of which are Japanese government bonds and Japanese equities.
Japan’s Big Three Property & Casualty Firms
Again - I don’t care how annoying I’m being with my repeating this: I have no fucking clue what I’m actually talking about in this sector - but I did to some flash research to try and prep even just a modicum for the purposes of this note.
Japan property and casualty insurance companies have been aggressively engaged in global M&A for many years (decades) due to no further growth opportunities domestically, and now have direct exposure to a wide array of things (including space insurance - yes, like outer space and rocket launches) and geographies- the US market being one of their key subsidiary earnings contributors, very much including underwriting fire insurance in Southern California / LA.
The big 3 non-lifers also have massive investment portfolios, which hold both domestic securities (JGBs, Japan equities, as well as illiquid shady credit and loans and the like), AND massive holdings in the largest and most liquid overseas markets - which not only includes USTs of course, but also UK gilts (and basically every major sovereign bond market), and to a lesser but still non-negligible size- public foreign large cap equities.
It’s also probably worth mentioning a few unique characteristics to these particular companies - though to what degree of relevance for this thesis, I don’t know:
•MS&AD, Tokio Marine and Sompo were recently caught in a price collusion scandal - for which they had to pay penalties to Japan regulators in mid-2024.
•They were also on the hook to pay out claims for recent US hurricane damages - thereby (presumably) depleting disaster reserves recently.
•They also were forced to unwind their cross-shareholdings, and are doing so now. For those of you who don’t know - “cross-shareholdings” in Japan is yet another uniquely non-capitalist part of Japan Inc culture stemming decades or more back, where giant publicly listed companies would be major shareholders of one another’s other publicly listed clients’ shares, for “good franchise relations/customs” - for which foreign activist investors and shareholder proxy groups and the Tokyo Stock Exchange and even public authorities who have been telling them “enough with this nonsense - cut your fucking unnecessary cross-shareholdings down, free up capital and pay out to your ACTUAL shareholders” is now finally coming to fruition, and these 3 are currently unwinding and realizing massive PnL gains - so they do have this one off cash source at the moment.
All of that is to say - this is a particularly shady industry in a particularly Japanese way undergoing a particularly unusual balance sheet transformation at the moment- so even if you know how the fundamentals operate, this time is a bit different.
Either way, I think it’s far more likely that they need to tap their enormous (ten of billions USD in AUM each) portfolios, and liquidating their (perceived) most liquid assets to raise immediate cash to pay out claims to LA policyholders, for which the estimates on the insurance costs notional damages seems to rise in increments of +$10 billion per refresh.
Preliminary estimates for overall insured claims came in at $10 billion last week by Wells Fargo analysts covering the sector. That estimate got kicked up to $20 billion in a day, as fire containment remained at 0% contained, and now sits at over $30 billion by Goldman’s estimates as of this writing.
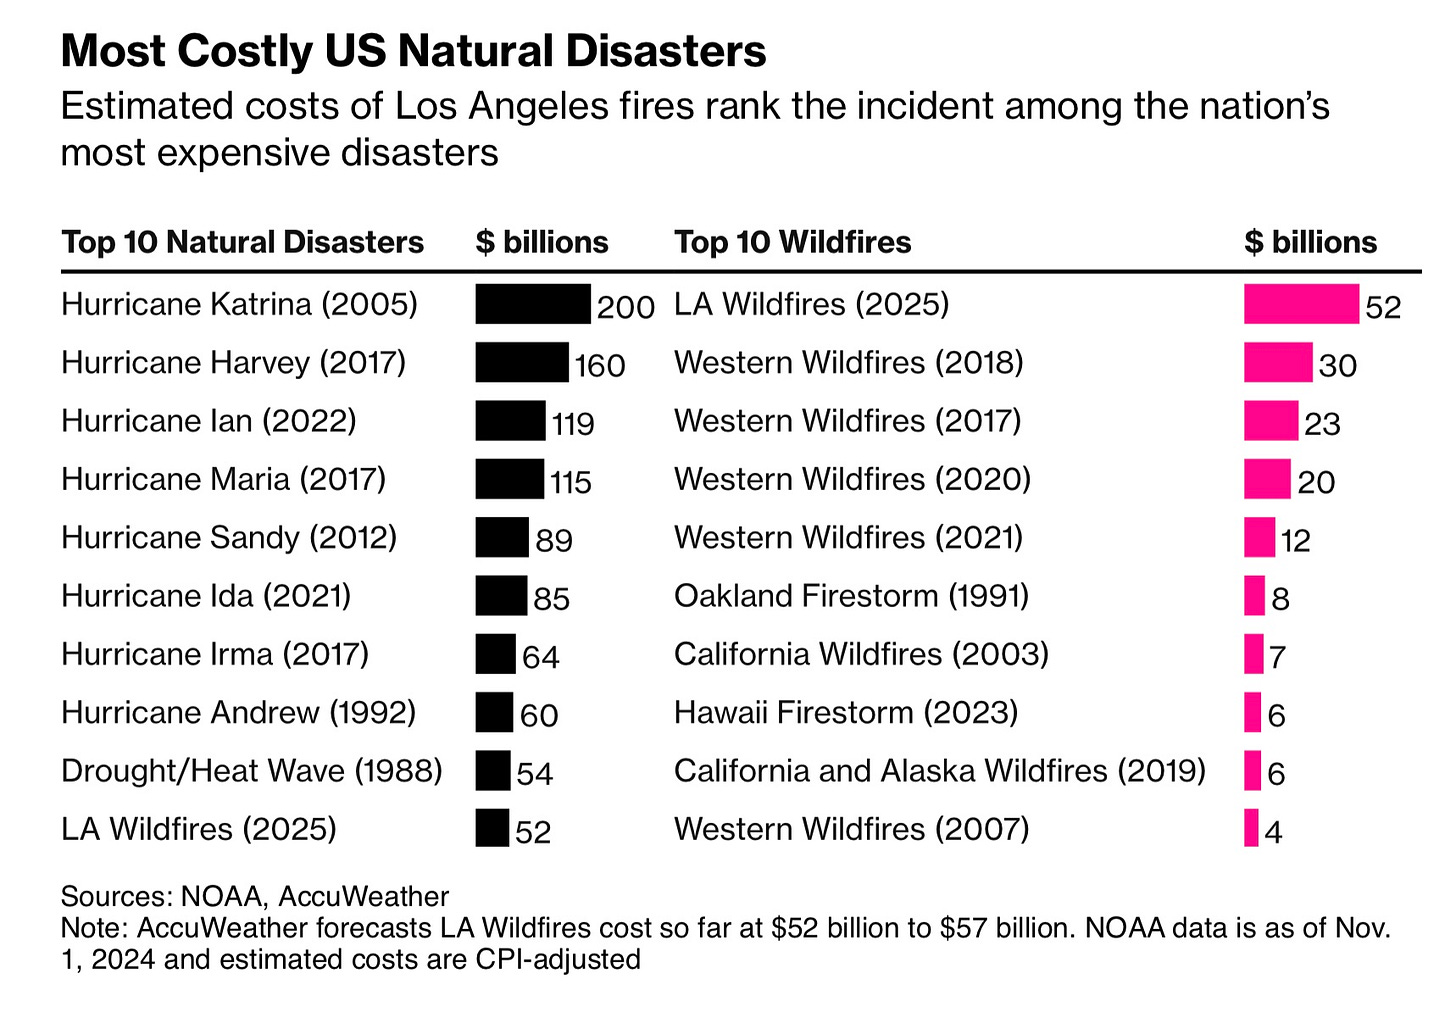
As for total economic cost estimates, LA 2025 takes top spot among the worst US wildfires by a mile.
Here’s a quote from earlier this week:
Japan’s Tokio Marine Holdings is “making group-wide efforts to pay insurance claims to those affected as quickly as possible,” President Satoru Komiya said at a briefing in Tokyo on Jan 14. It’s too early to estimate the impact of the LA wildfires on the insurer’s business performance, he said.
Tokio Marine, along with Japan’s MS&AD Insurance Group Holdings and Sompo Holdings, are collectively exposed to about 3 per cent of insured damage from the California fires, according to an estimate from Mr Steven Lam, an analyst with Bloomberg Intelligence.
The key to the above passage is the speed and immediacy in which they are trying to pay claims owed - as that would further reinforce the price indiscriminate speed in which they may be executing their cash raising - but again, what the hell do I know - but worth pointing out just in case it matters.
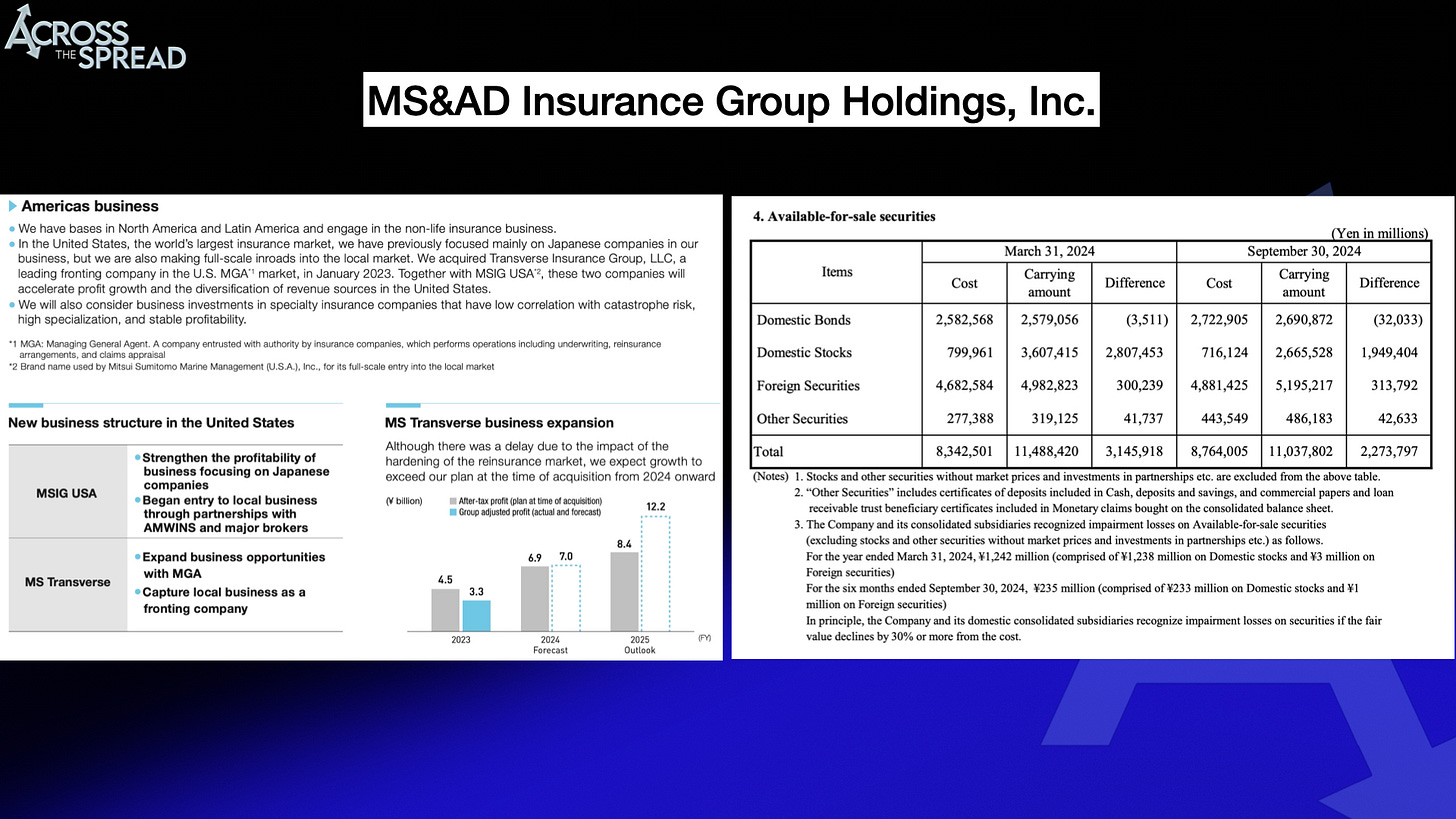
Here are slides from their latest earnings presentations on their portfolio assets:
Insurance sector ex-Japan
Note that the global bond yield move doesn’t have to necessarily be just Japanese parent insurance companies. I know that Europe has a robust re-insurance sector, and that London is a (if not THE) major financial hub of the world for such businesses. Hence the UK gilt move- perhaps it’s the same situation of domestic government bond holdings liquidation occurring in the City of London for those who may have LA wild fire catastrophe losses.
“Major European reinsurance companies are also likely to be hit with significant losses as the number of claims mount. These losses may amount to approximately $1 billion (€0.98bn), according to Berenberg analysts, as reported by CNBC.
Swiss Re is expected to face a loss of about €160 million, whereas Munich Re could be looking at losses worth approximately €220 million, according to Berenberg. Similarly, Hannover Re could suffer a loss of around €180 million, with Société Commerciale de Réassurance (SCOR) potentially losing €50 million.”
That said, I also read that reinsurance typically does not cover much in residential property - so they may not be as in need of asset fire selling for immediate liquidity like the Japanese direct insurers.
Ok- let’s get back to my lane.
Green & Red Blinking Tickers: Japan Insurance Company Stocks
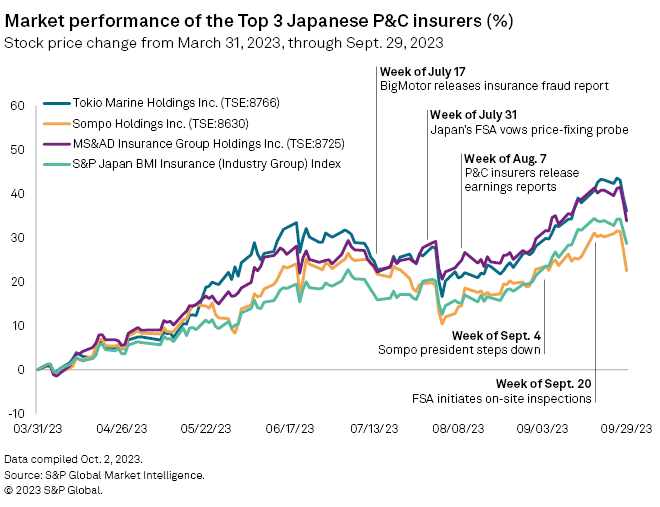
Here are the big 3’s performance charts, as well as their TOPIX sector:
The reason Sompo Holdings breaks away and surges halfway through the chart is because that’s when they released their most recent earnings, for which they announced an extension of a share buyback program, but in double the size (or more). And although this shareholder friendliness was far above analyst expectations, if I had to guess, I suspect that what you’re seeing in the Sompo massive and maintained stock outperformance is likely the act of the share buyback execution itself pushing shares higher, rather than some massive long only investor buying up a stake in the company with horrifically bad, market impacting trading execution.
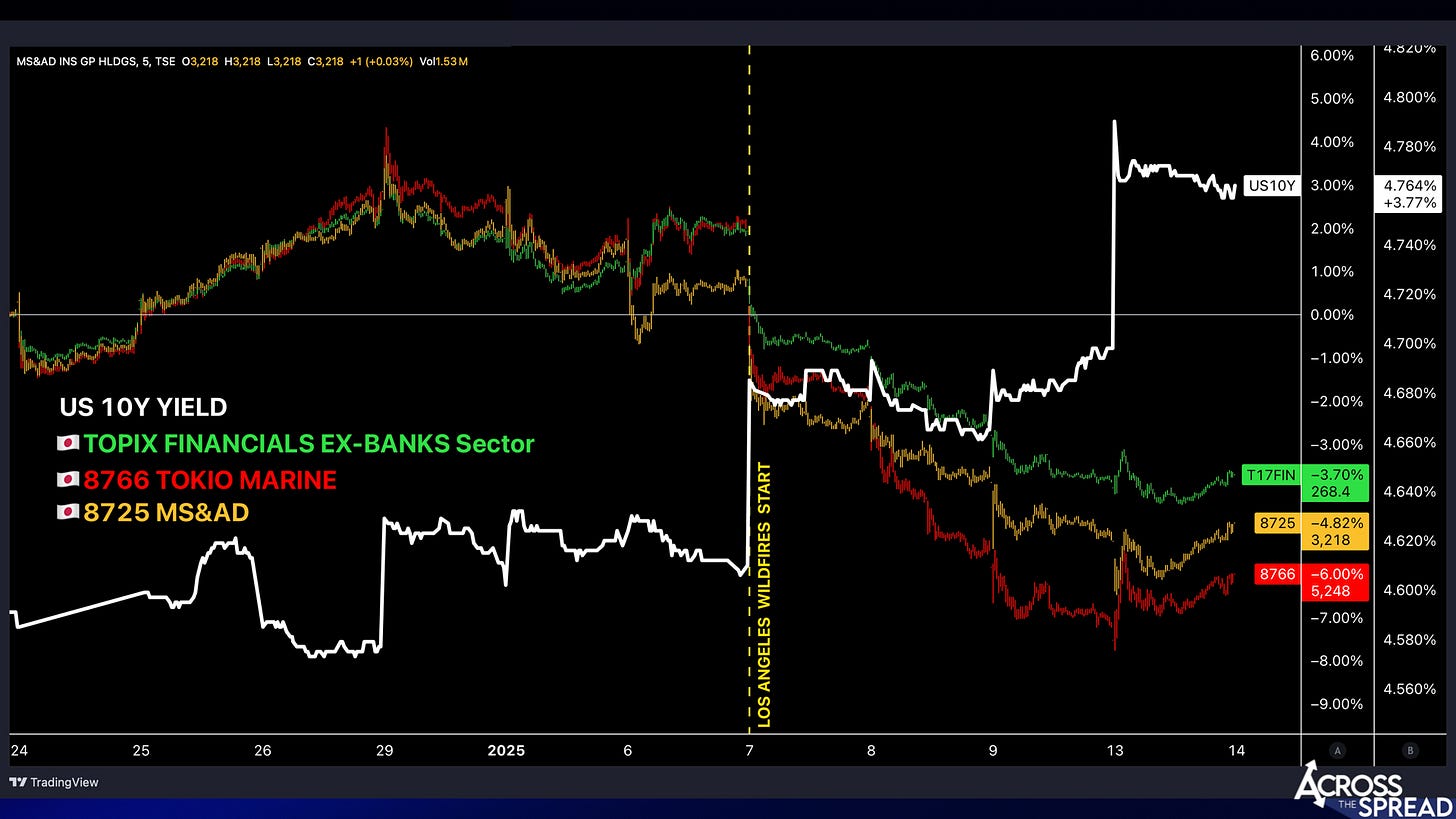
I will remove Sompo from these charts going forward because it’s just unproductively skewing the chart visualization/ but before I do, same chart + 10Y UST yield overlaid:
Notice that these financial stocks move in typical tandem with yields directionally - until they suddenly don’t anymore at the end. Because it’s UST fire sale time, in conjunction with investors selling down these LA fire exposed property insurance stocks time - i.e. these stocks and the bonds they hold are being sold off simultaneously, as LA fire continues to spread.
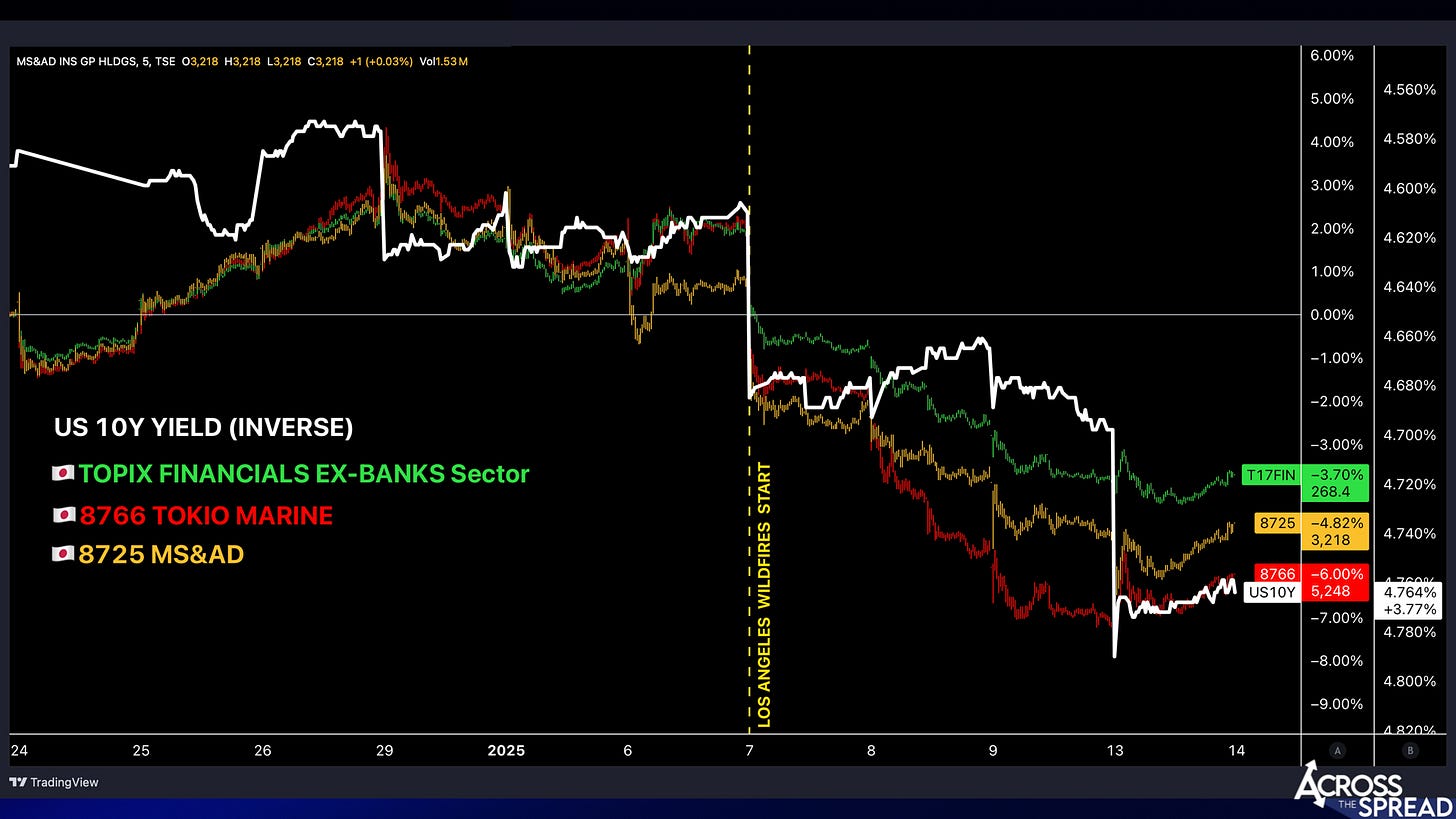
Same chart, inverted the US 10Y yield, for a better visual.
Note that this chart is of these 3 Japan listed cash equities - i.e. Japan trading hours. Remarkable how closely the 10Y UST yield follows the price action- but again, not too surprising if you subscribe to my theory - that the sharp rise in bond yields is a function of what’s happening in LA. At the very least- in part.
Again, this may very well be complete nonsense, and if it is, I can accept that, because I know that I don’t know the sector.
But I genuinely do not think it’s nonsense at all, and most importantly - the reason I’m sharing this is because it does make some reasonable sense, but YET AGAIN - for god knows what reason, NOBODY (that I’ve seen yet) seems to have made or suggested this very clear potential observation and tie. And if this ends up being even a tiny bit correct, this isn’t “smart” on my part, this is yet another real time, real world example of just how embarrassingly cluelesss the blinder-wearing so-called “market professionals” and their pathetic career institutionalized minds are - and that’s a wonderful thing to exist, and for us to be able to exploit.
Finally…
“So, what’s the trade???”
The following point does not apply to most of you who are subscribers / followers of Across The Spread - you already know what and how to apply what I’ve shown you in your own way to your own situation as you see fit, provided that you even agree with any of this, that is - and I love and respect my audience for this reason (among many others) with all my heart.
For some of you, you’re thinking / saying out loud right now: “Weston, so what’s the trade??”
It’s a new year, so me just remind/tell you how this works.
By and large, I don’t give trades out. Not because I’m mean, or secretive, or whatever other fictional motive - I don’t because I can’t. By which I mean - nobody can, it’s impossible to.
If I somehow can know what the direction a particular green and red blinking ticker will go (let’s say- downwards) - what am I supposed to say that will satisfy each and every one of those on the receiving end of it?
“Short XYZ?”
No.
What if you already own XYZ - you wouldn’t be opening a new short position via borrowing to sell, you would be exiting an existing long. And who am I to know if that’s appropriate, or smart? I don’t know where you got in long, what your objectives are, risk tolerance, skill level or any of those unique individual characteristics multiplied by thousands.
If I did my work and made a case that XYZ is going to fall, all I need to do is to present that to you all - and then you each can take that and act upon it (or not) in your own way. Maybe you’re short term and aggressive, and will short XYZ. Maybe you’re already long, and are preparing to buy/add to your position into the downside. Same call, 2 opposite traders. Or, maybe you’re an options trader, so XYZ↓ means you’re going to pull up the puts to see how they’re priced. Maybe you think I’m a spectacular reverse indicator clown and lever up long. That’s why it’s impossible for ANYONE to “give trades” through a screen. And yet many people are in the business of doing just that- and good for them. I’m not that, and I never will be.
Again- what is at the consistent core of my mission, my purpose? To find and make the case for a differentiated viewpoint that is missing from the broader public discourse, and most importantly missing from market pricing.
So here is one example of how one might potentially use this info that I’ve presented above, if you believe in it. And keep in mind that as much sense as this (or anything) might make, ultimately the market reaction can be anything or nothing, to anything or nothing.
What’s the consensus narrative around explaining this bond yield move higher?
“Donald Trump’s tariff and tax policies are inflationary, and markets are realizing this….”
So what did I provide here? I provided that:
A) No, this bond yield move is NOT some fucking 2 month delayed (and also somehow simultaneously, 1 week too early) market “reaction” to President ELECT Trump and his long understood / still nonexistent policies.
B) Rather, it’s highly likely a domino reaction to LA wildfires and those who are on the hook to pay out massive sums of capital and increasingly so as long as it’s still spreading and destroying property.
Now, I personally wouldn’t take this as like a-
“…follow developments of the LA fire closely and go long USTs / JGBs the moment it’s extinguished…”
That’s not what the/my play would be. Generally speaking, one way to apply this is:
Markets/market participants by and large are of the belief that Trump policy induced inflation is pricing / priced into bond markets- when in reality, only some, or perhaps NONE of Trump is priced into bond markets - LA on fire is moving bond portfolios, but the broader market moving capital is oblivious to this.
And, if you also are of the belief that Trump might fire off a few aggressive rounds of hawkish inflationary rhetoric for imminent tax cutting and tariff hiking at his inauguration speech- that flow isn’t what’s currently elevating yields- that has yet to come, and the investing public may be caught off guard by another +50bp move in long dated yields coming off inauguration day.
So go long a TLT put spread with 1 week expiry (or whatever the hell your “USTs sharp sell off catalyst in the near term, for the near term” trade is).
Or any other one of the infinite ways to apply this to exploit in markets. Bottom line is- if I’ve identified something that the masses of capital have not caught onto - which is extremely hard to do, and highly unpredictable when the universe presents such an opportunity - that’s what I’m here for. How (or IF) you utilize what I present is 100% on you, and that’s a wonderful thing- we wouldn’t want it any other way.
Fortunately, nobody outside of Japan pays attention to Japan until in real time, let alone has a grasp on the mechanics of Japan/Asia’s broader market impact- AND, Japan, the basketcase that it is, can provide many such overlooked opportunities in its given state.
Generating Value
I frequently used to sign off by saying something along the lines of - “if you found any of this to be of genuine value, please subscribe, follow, like, share, in order to support me and Across The Spread.”
While I of course mean the above statement, it is only partial. At the end of the day, all of this is just words on paper, green and red blinking ticker charts on a screen, and an overly-excited, fast-talking Hawaiian-looking dude on a video clip. That goes for any/all market commentary/commentators out there (though maybe not the Hawaiian-looking part).
Its now in YOUR hands to then take what we have laid out, and then actually turn it into genuine value - however it is that you define “value.” Over the years, many of you have reached out to me as “fans” of mine (perhaps you may be one of them), and very often (and likely subconsciously so), you/they will actually introduce themselves to me - NOT by telling me who they are, what they do, where they’re from etc, but rather, by going straight into telling me HOW it is that they extract and realize value out of my content that they consume - and “value” does not only/always mean something monetary (though obviously is the case for most in this context).
“…was able to avoid losses…” - is something I hear most often (and likely because of the nature of the message, which is just to “thank” me), but this to me is far more valuable than generating market gains.
“…have learned so much from your content…” - is by far the most meaningful to me personally, and is in my opinion the highest form of value generation that people do for themselves because you cannot put a price on self-growth, whereas any trade or portfolio event is very quantifiable and thereby limited, no matter how large.
So, I not only will I scour the world to try and find, identify, and bring genuine and unique value to you throughout 2025, but I truly hope you each find your own ways of application, and turn my rhetoric and commentary into something of genuine value as you define it for yourself.
Thanks as always,
Weston
2025 Outlook (Preview)
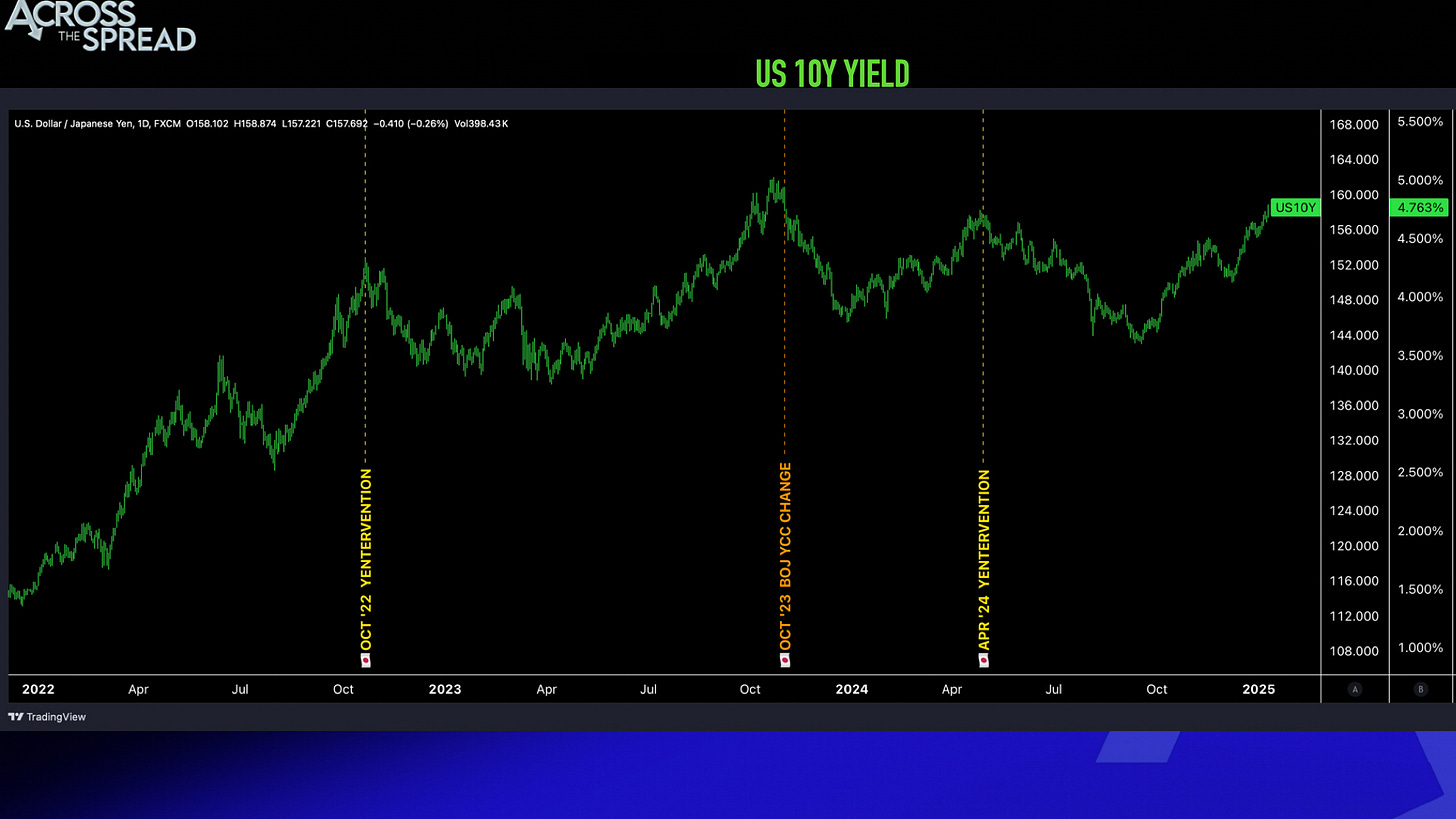
Markets In Review: 10Y US Yields
Since 2022: Current era, defined by risk-free yields breaking out of their ~1% range that they had existed in for a decade and a half during the post-2008 QE era.
10Y UST yields, or the risk-free rate, or the financial world’s most important price, has risen sharply, and finding its new approximate trading range of ~4% lower end to ~5% upper end.
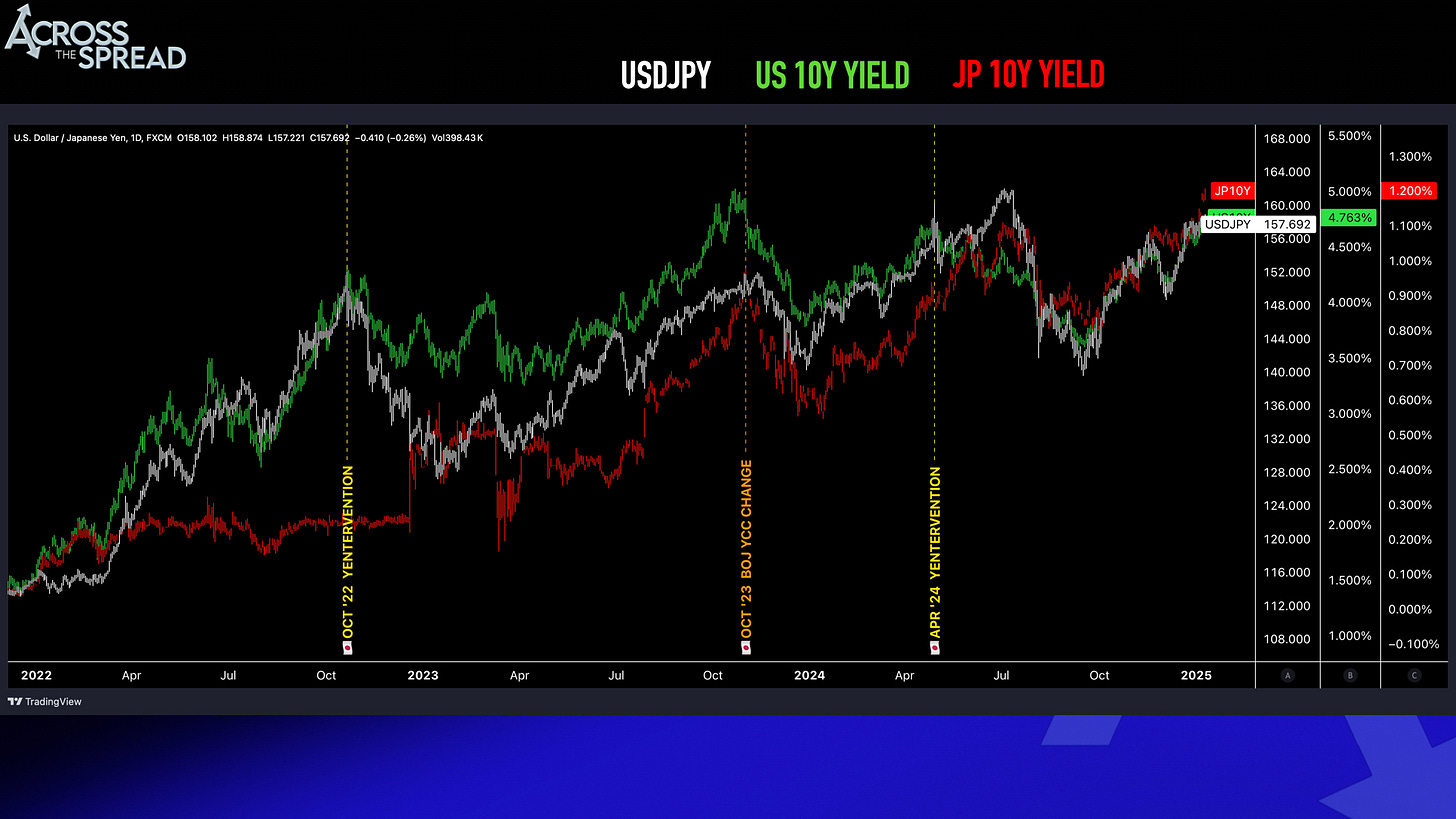
The reason, the catalyst, the force behind each of the significant uptrend-turning points on 10Y UST yields over the past 3 years has been: Japan.
“Japan” meaning: Japan policy aimed at Japan markets, which spills into the rest of the world. Bank of Japan and rates / QE policy on JGBs, and Ministry of Finance yenterventions on JPY.
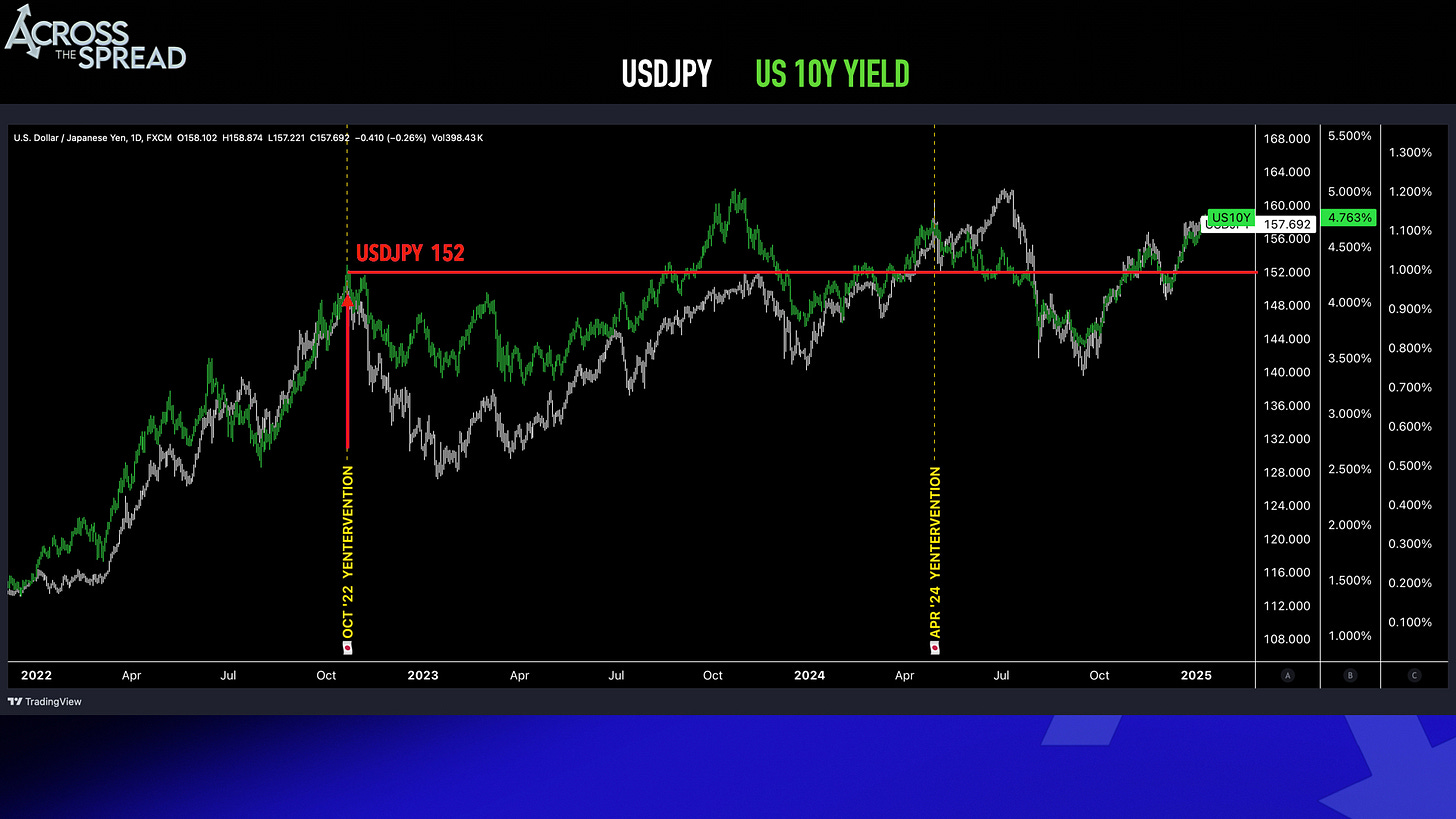
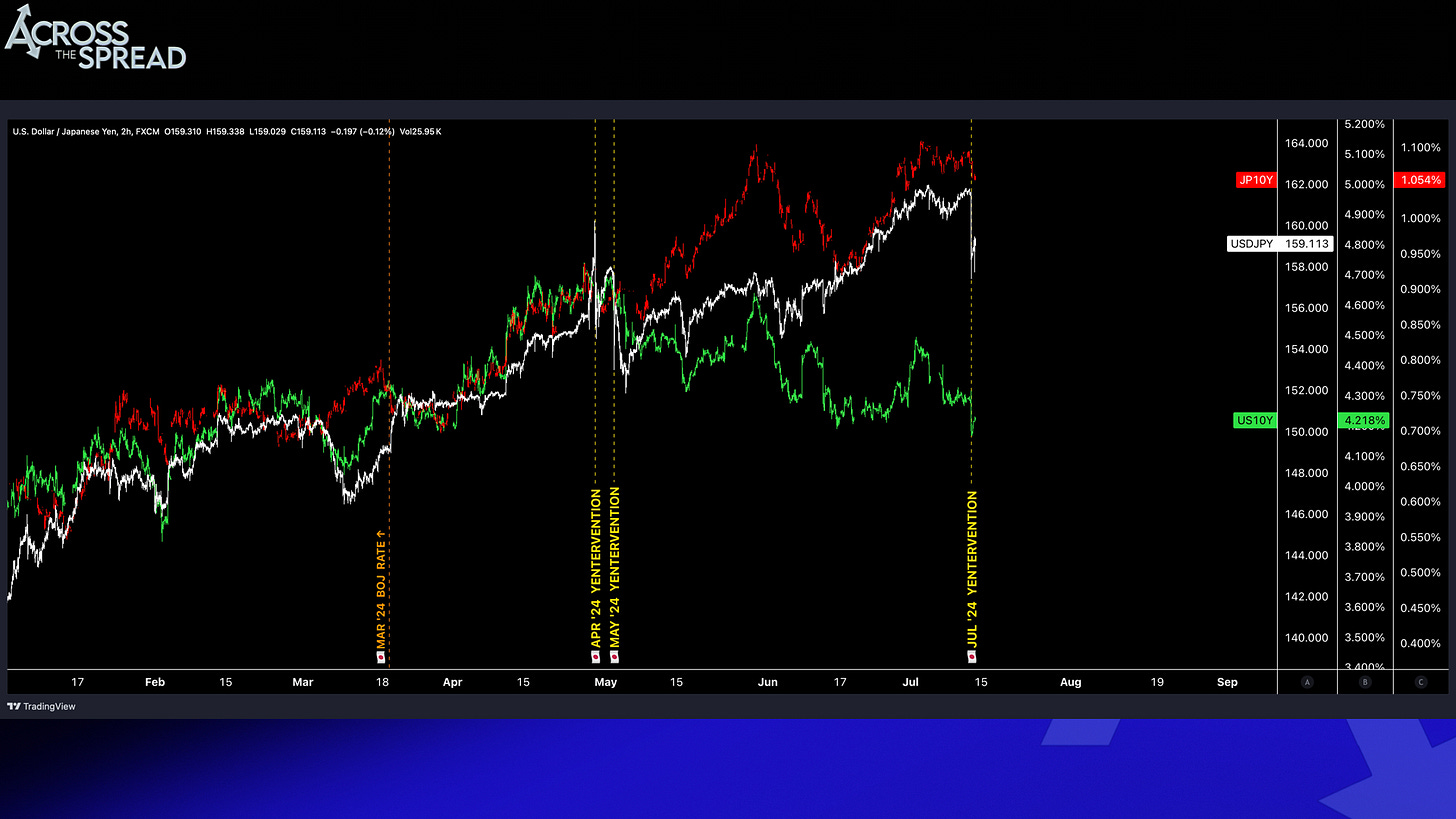
2022: 10Y US Yields ripped higher by nearly +3.0% in half a year, from ~1.5% to near 4.5% on a vicious and unstoppable, one directional momentum run - until it did stop, and sharply reverse on October 22, 2022 at 10:30AM EST. What stopped it, when nothing else could? Japan Ministry of Finance yentervention - who was acting at USDJPY 152, a price level that will come back into the picture in 2024 in a significant way.
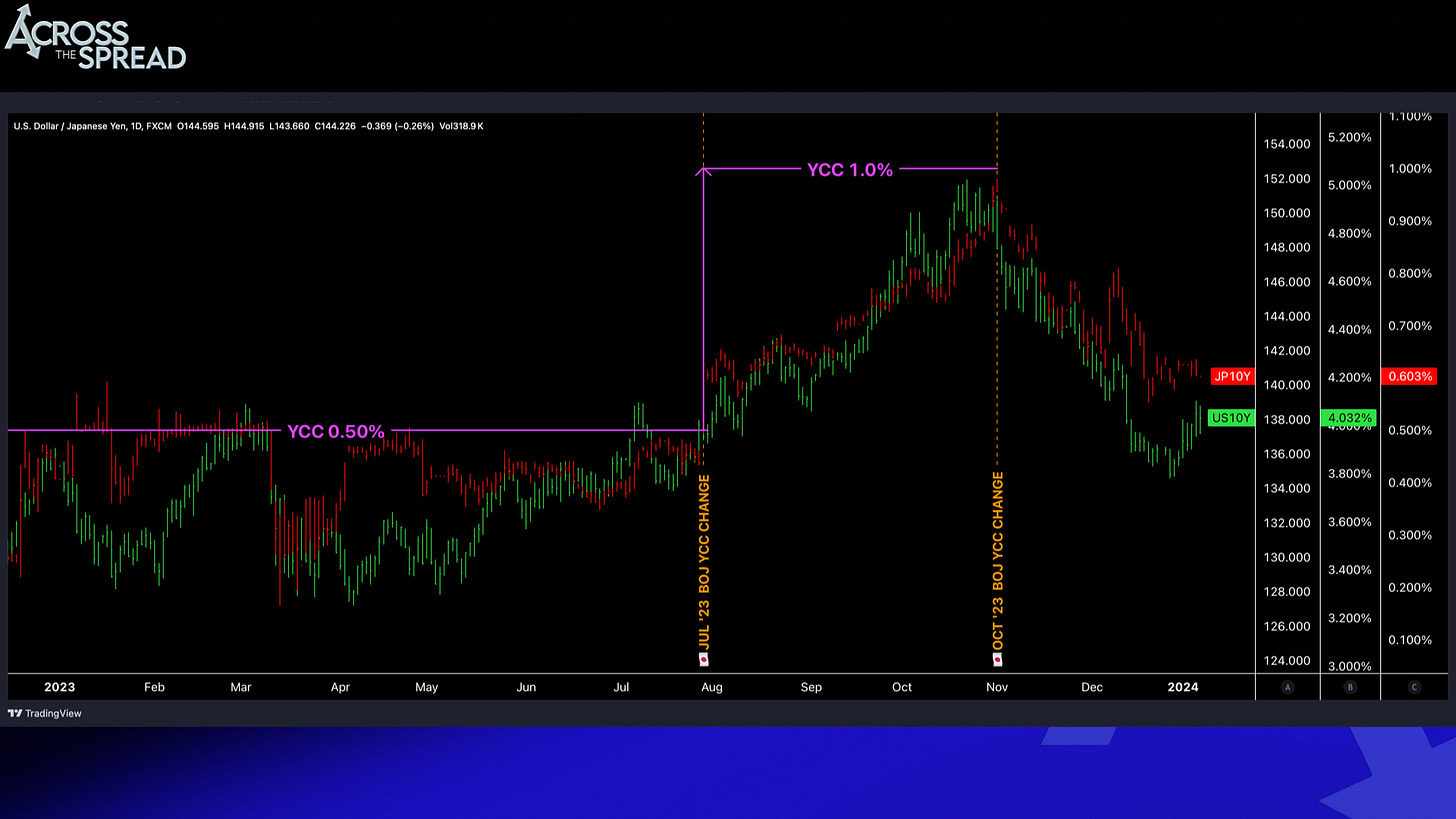
2023: 10Y US yields market direction was almost completely a product of BOJ and Yield Curve Control policy changes.
2024: Japan Ministry of Finance yenterventions once again reverse 10Y UST yields at the end of April ~ start of May. But this time, MOF’s non-economic and unnatural act of yentervention had “broken” the JPY and JGB market relationships, and created a nightmare for BOJ and Japan - JPY was no longer strengthening as US yields fall and JGB yields rise (narrowing the US-JP yield spread), but rather, JPY was WEAKENING alongside RISING JGB Yields. In other words, BOJ rate hiking/higher Japan rates and yields was no longer a yen supportive tool at their disposal.
The most significant turning point moment in global markets for 2024:
July 11th, 8:42AM EST, 12 minutes following a softer than expected US CPI print, MOF once again yentervenes at USDJPY 162.
This marked the YTD top in equity markets and USD, and the start of short JPY position unwinds, short covering, and JPY carry trade exiting. This short-JPY exit was self-perpetuating for the rest of the month of July, as risk assets helplessly fell alongside JPY strength, but did so in a relatively orderly manner. Until it wasn’t orderly anymore. Pre-Black Monday (“Black Thursday and Friday”), TOPIX index had fallen -2% and -5% - a red flag for what was to come.
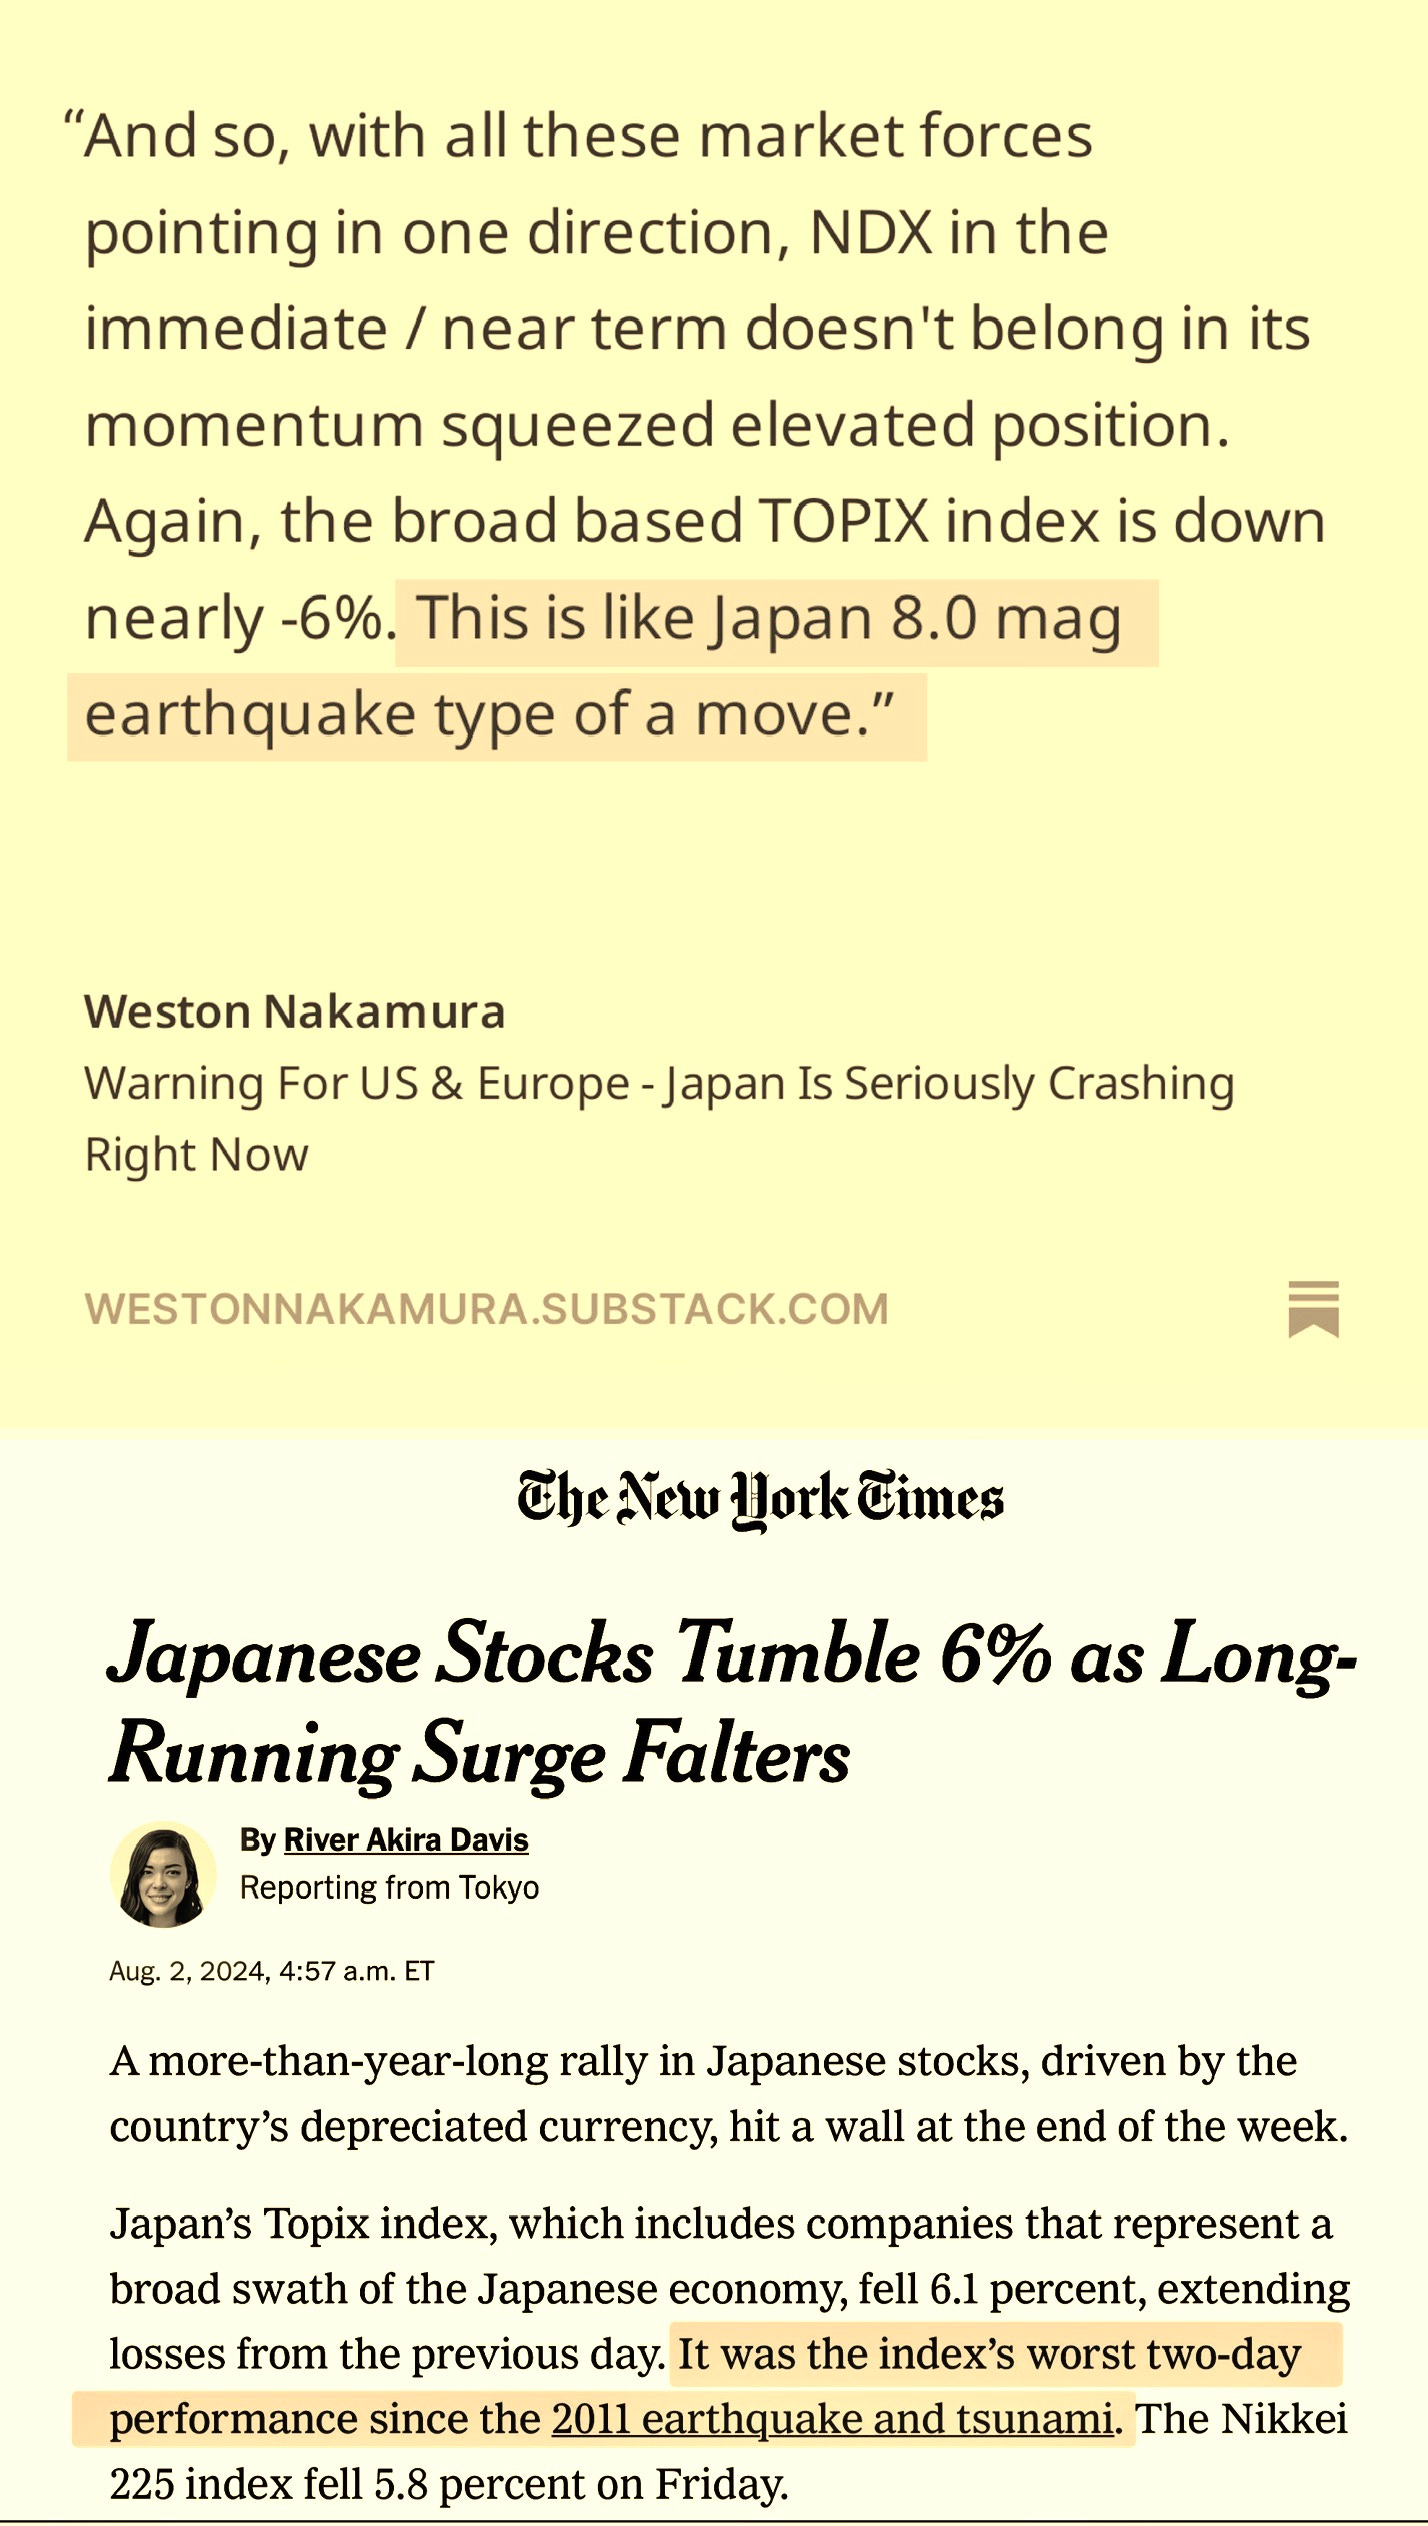
When USDJPY’s downside from 162 had reached, then breached 152 - all hell broke loose in global, cross asset markets - Black Monday: NKY drops -12% intraday and hits global indices, very much including NDX.
But its important to recognize that it wasn’t just JPY strength that had “come out of left field” to interrupt US equity market upside from July 11th yentervention and USDJPY 152. JPY’s impact on US equity markets did not begin mid-year, it had been contributing to, if not outright driving US equity market strength throughout the year leading up to mid-year turmoil.
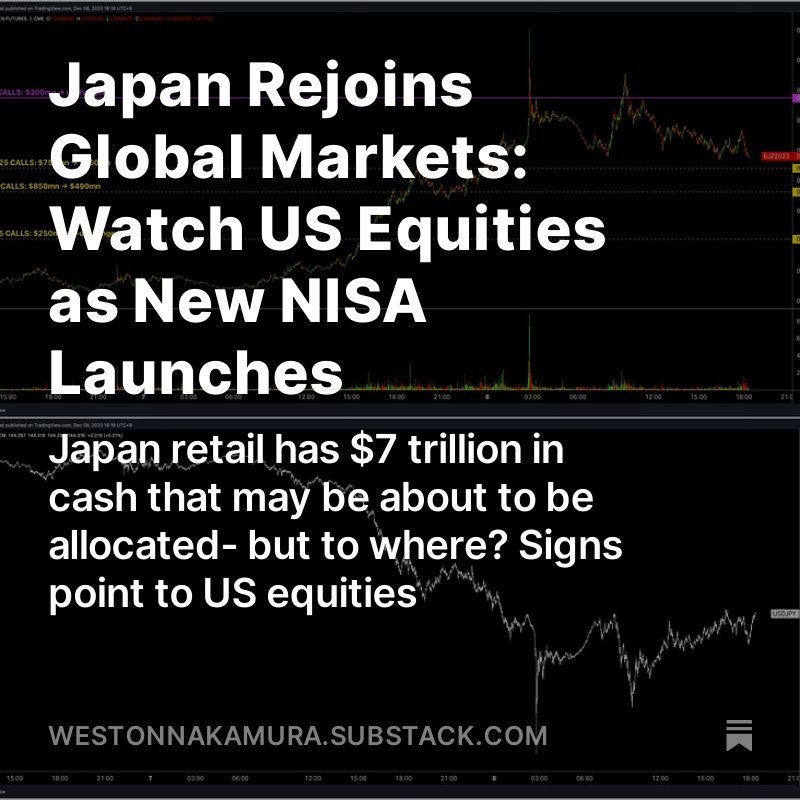
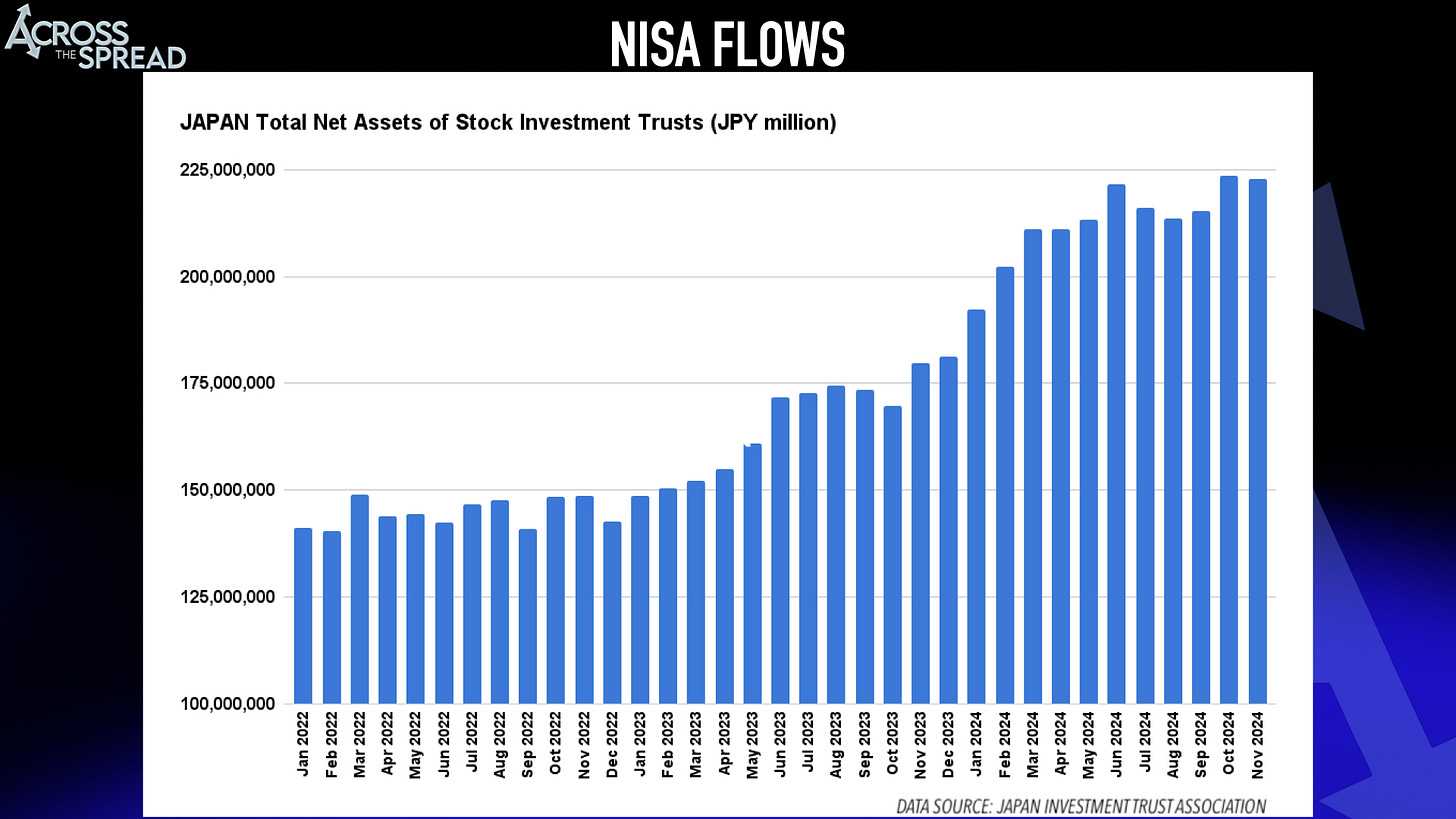
This is thanks to Japan NISA flows - which was the very first topic that was flagged from Across The Spread in January 2024.
And of course, throughout 2024 - flagging the fundamental change in Japan’s massive pile of dormant cash: capital flight out of JPY.
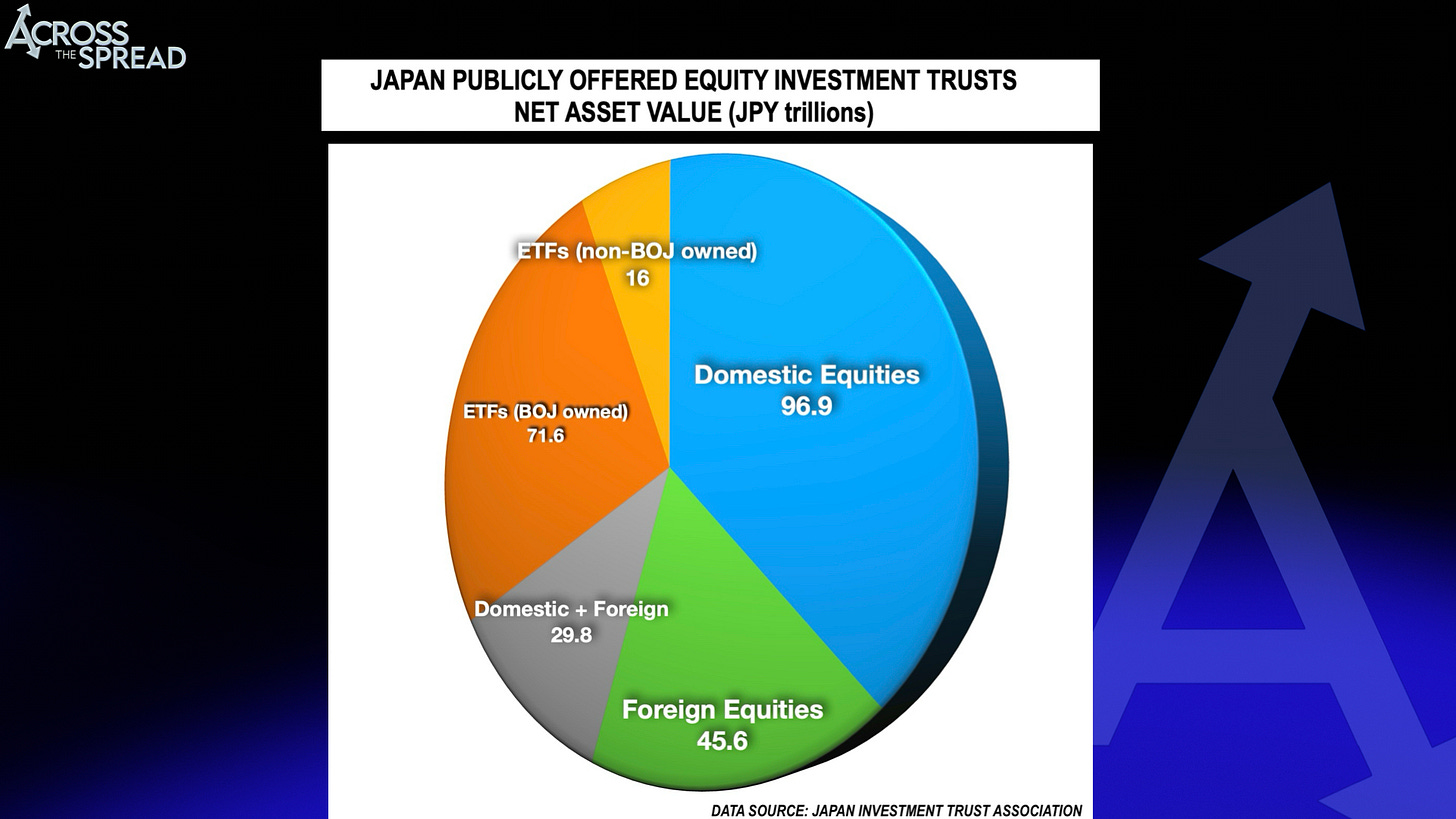
Japan revamping NISA from the start of Jan 2024 saw 11 trillion JPY of flows into equity mutual funds in the first 11 months of the year - or, essentially averaging +1 trillion yen per month of capital flowing into equities.
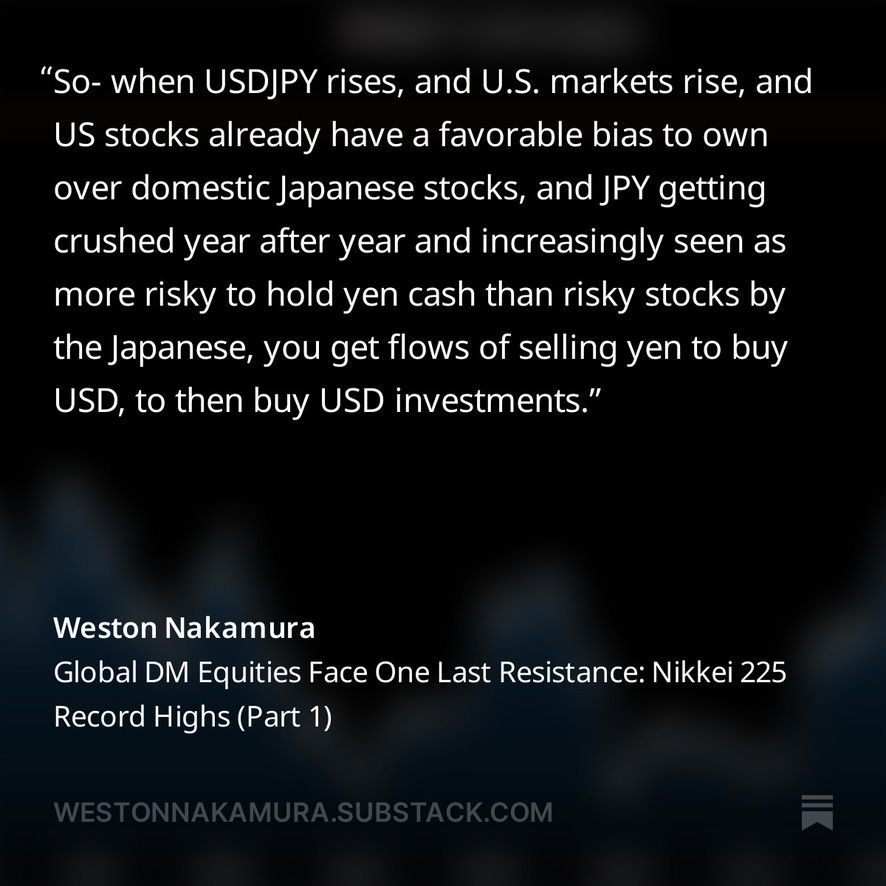
But again, a massive portion of JPY cash finally being mobilized into financial markets was NOT for “investment” sake - it was for getting the fuck OUT of the world’s worst performing currency for 3 years running. Yes, this time was/is different, because this time there is a phenomenon that hadn’t previously existed for an entire generation: Japan inflation. Combine that with their JPY denominated cash savings getting decimated and what do you get? Household cash JPY → FOREIGN (or, NON-JPY) assets. And what does NISA investment scheme allow investment in? Equities.
In 2024, NDX was up about +25% on the year (a year which included a mid-year crash) - so that’s pretty good, and again, that was largely a function of Japan households’ cash being put to work, due to JPY getting destroyed. So as good of a return as +25% on NDX (or QQQ) is, it doesn’t compare to the return profile of a JPY-based investor into the same exact NDX/USD denominated assets.
The question is- are NISA flows going to continue at the same pace as in 2024?
(My thoughts on this matter are quite interesting, and will of course be in the full release).
Bank of Japan
On the eve of the Dec’24 BOJ meeting- the great
of course asked me what my thoughts were heading into the last major central bank policy meeting of the year - and my answer was…And indeed, my taking a stance of “I have no idea” was 100% exactly correct an approach. Because what subsequently came was yes, a policy hold, but what really moved markets (JPY sharply weaker) was one comment out of Governor Ueda’s press conference: “…need to see one more notch…”
NOBODY in BOJ Watchers-land had explicitly said “JPY will weaken because Governor Ueda will express hesitation to hike rates in January because he needs to wait for further wage data confirmation.
You know why nobody made the above call? Because Governor Ueda himself had no idea that such a stupid remark would spill out of his mouth at the press conference until it was happening in real time.
So, with regards to the Bank of Japan and policy - yes, of course I am always very humbly flattered that I am seen as some “BOJ expert,” but I have always said there is no such thing as a “BOJ expert" - not even BOJ members themselves, because they themselves don’t know what they will do until last minute, and even then, don’t know what the market response (and then their own heavy handed response in markets to the market response) will be. Never have I meant that more than current.
Bank of Japan “communication” needs to be by and large “heard” but not listened to. And if you (as in we, the “BOJ experts”) are genuine and honest in our practice, then our default stance going into 2025 should be what I said to Maggie - I don’t know what BOJ will / won’t do. But that is not what institutional salaries pay for, and so you will always get some forced opinion. I on the other hand have the freedom and flexibility to say that I don’t know when I don’t know.
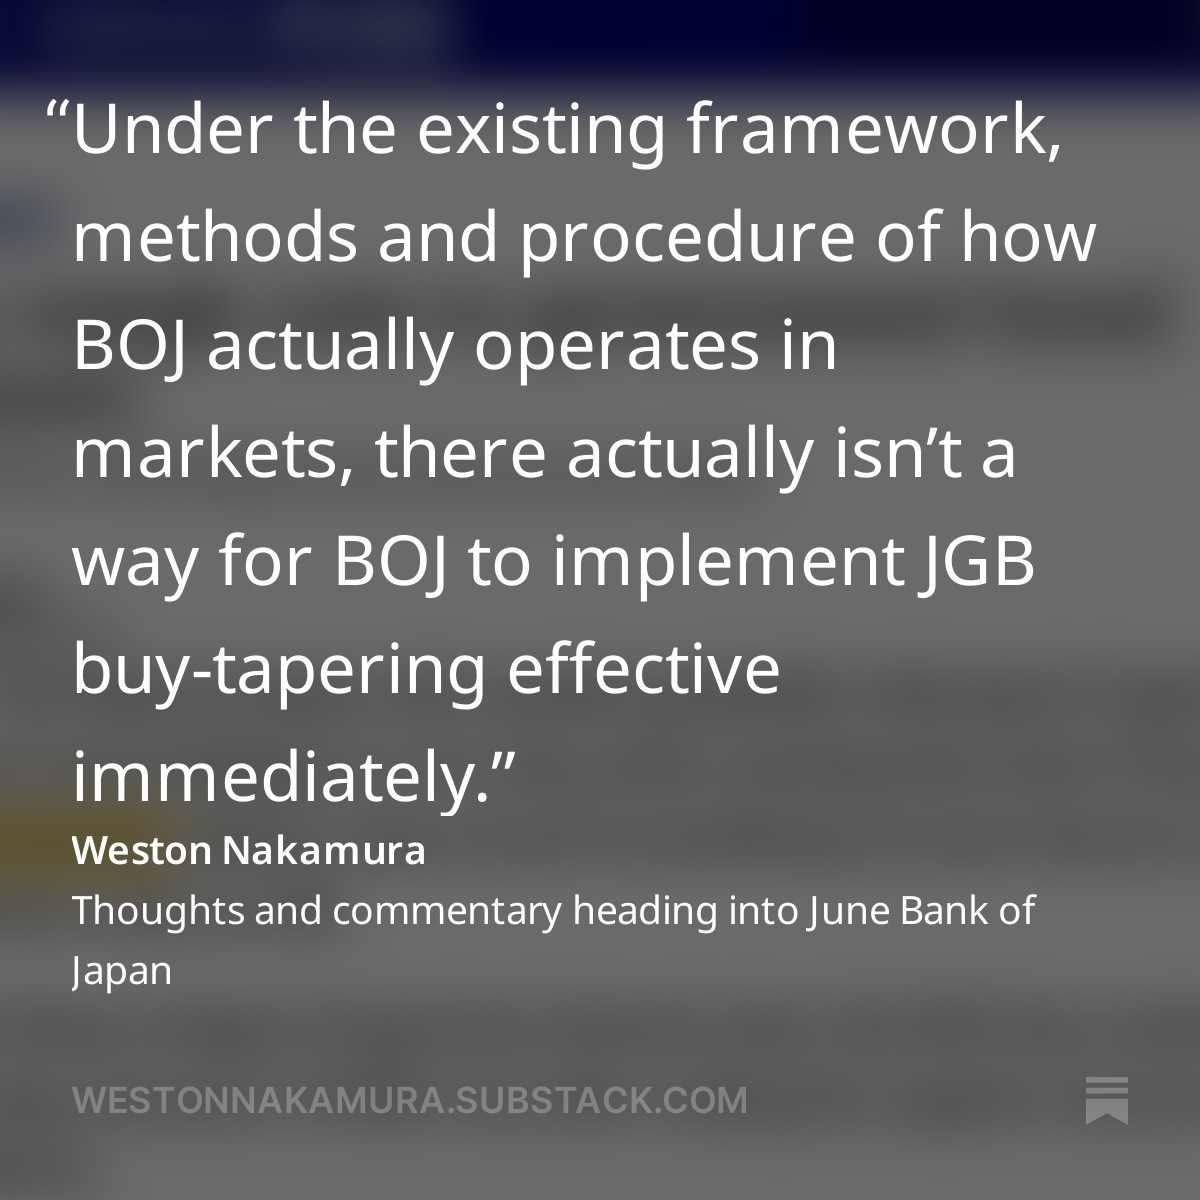
Note that this doesn’t mean I have a perpetually non-existent view on BOJ by any means - when I DO “know” or have an idea, I will obviously share it. Best example from 2024 - June BOJ’s “big disappointment” as perceived by everyone was that JGB tapering details were not being implemented immediately from that June meeting forward. As I had flagged both before the meeting, and then once again after the June BOJ policy release of “details of JGB tapering will be released at the next BOJ policy meeting” - of course this is all that would come out, because BOJ is structurally and procedurally unable make such tapering adjustments simply based on how JGB buying operations work.
I have also made the non consensus case for a potential policy change out of BOJ in 2024 as well - which did not ultimately come to fruition. So, when I have a view on BOJ, I will express it, and will attach a rough probability alongside so that its not completely useless by itself. And when I don’t know, I will give a resounding “I don’t know.” Because when it comes to BOJ policy guessing - “I don’t know” itself is/can also be a high conviction stance - and certainly not a risk-free stance. If BOJ makes a major policy change that should’ve been seen from a mile away, and you have a high conviction “I don’t know” stance heading into it, you should be taking a big credibility hit.
So, if you hear me say that I don’t know, understand that I say so with FAR more thought, research, and analysis behind it than if I give a directional view.
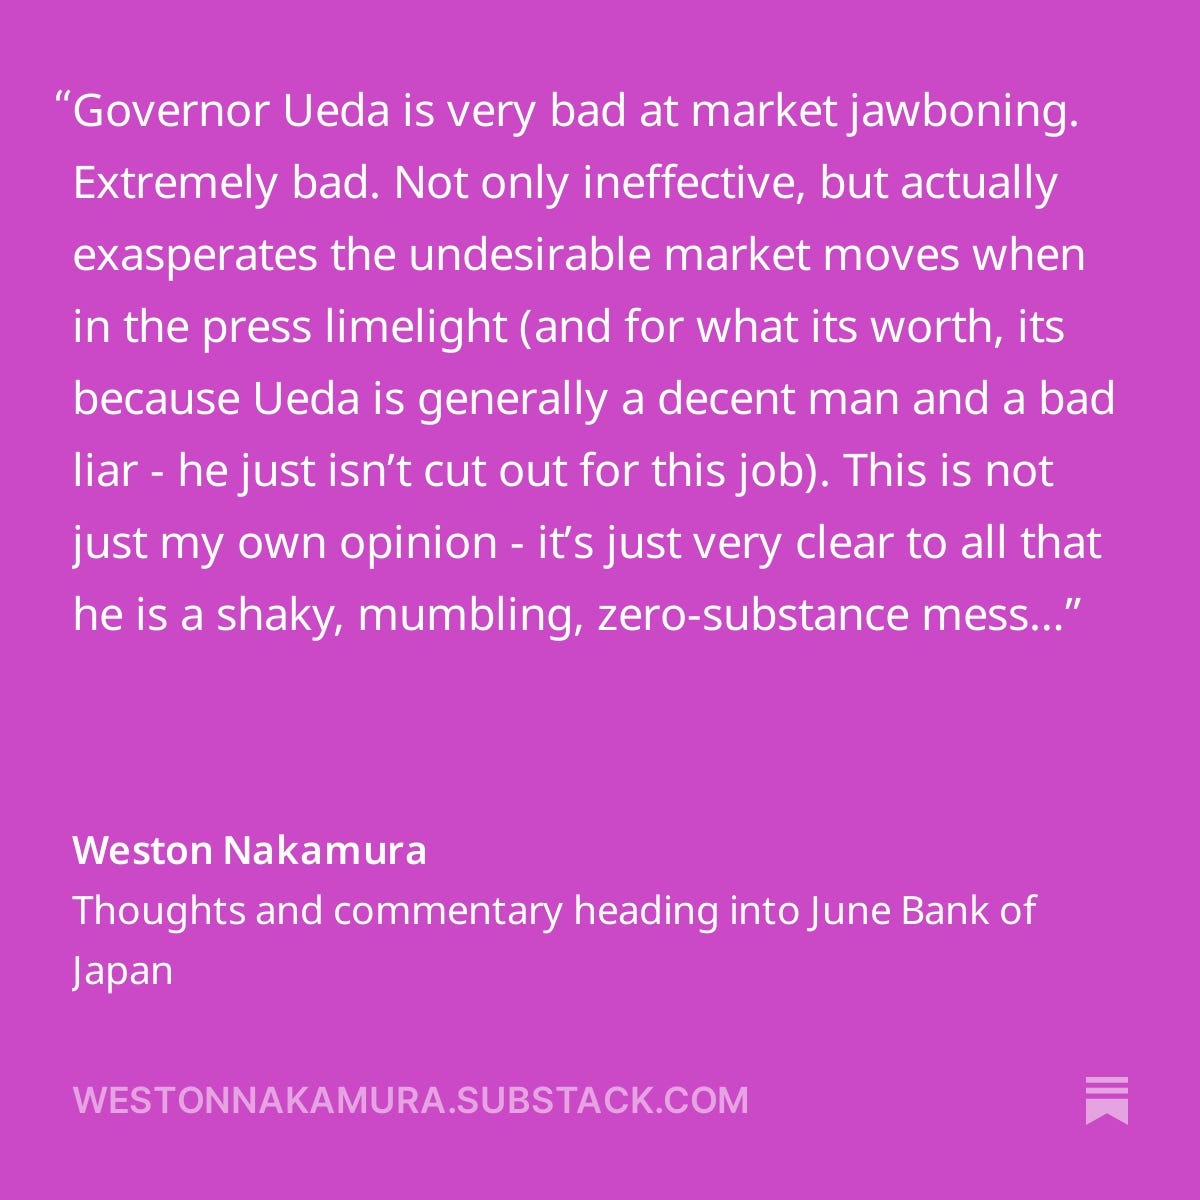
What will remain consistent in 2025 is Governor Ueda and his absolutely horrendous communication abilities.
And then there is this mantra:
This has turned out to be a completely bullshit deflection method, rather than an actual policy intent or framework shape.
Stay tuned for the full release.
Thank you for your support as always.
Weston
























Thanks Weston - you are the GOAT at seeing the "obvious" (to me - after reading your insight) that no one else sees. Always impresses me. Hope 2025 is a cracker year for you. Cheers.
Are china's yields intertwined in this or just their own idiosyncratic issues? I notice it went almost mirror image of US yields starting 12/6 with the first leg of the treasury selloff.